Percentage of employed population in European countries who report having depression
Reddit user: trinitronbx; Data: keepeek.com
Read MoreMapping public health.

Reddit user: trinitronbx; Data: keepeek.com
Read MoreThe map above shows the number of plastic surgeons per one million people. Those U.S. states in shades of red
Read More
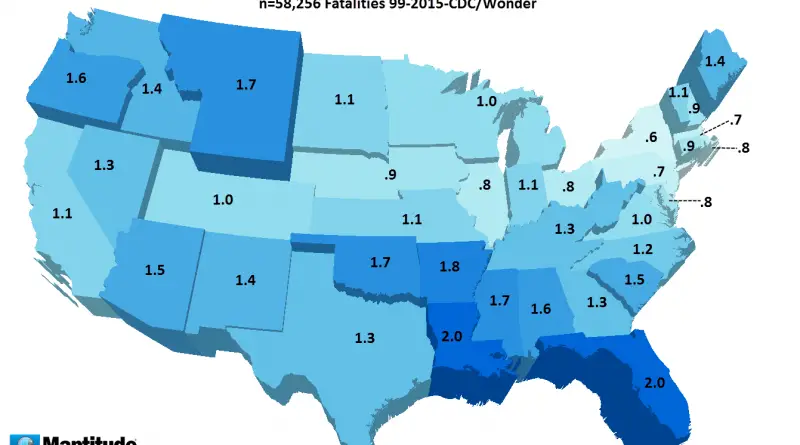
Unintentional opioid overdose deaths. Crude rate per 100,000 population. Related posts:– U.S. Drug Overdose Deaths (1999 – 2014)– The stunning spread of
Read MoreDoctors in some U.S. counties prescribed up to six times more addictive pain pills than others in 2015. Around two
Read MoreThe Well-Being Map is an online visualization tool that displays measurements of various characteristics for each U.S. county. For characteristics
Read MoreModern treatment methods include insecticides, the use of antibiotics, and a plague vaccine. The plague bacterium could develop drug resistance
Read MoreGallons of ethanol consumed per year, per capita, for the population aged 14 and older in each U.S. state. Source:
Read More