Agriculture

AgricultureVivid maps

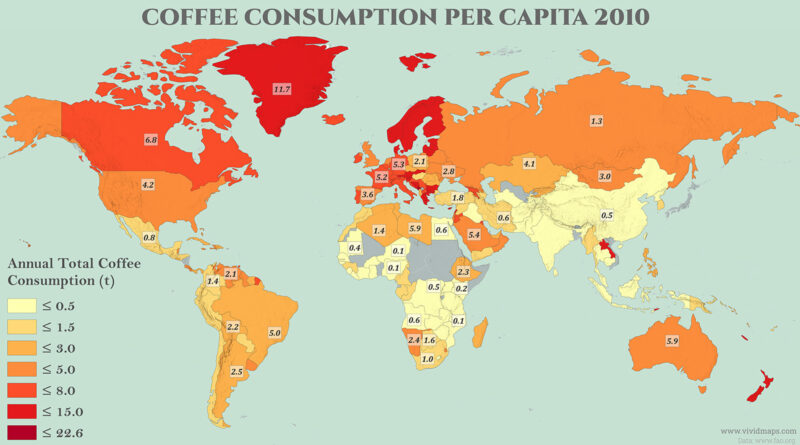
Coffee Consumption by Country in 2023 and How It Changed Since 2010

Global coffee supply grew from 8,612 to 11,576 thousand tonnes between 2010 and 2023. The United States remained the largest market by volume throughout the period. Laos supplies more coffee per resident than almost any other country, at 22.59 kg (49.8 lbs) per person in 2023. China posted the fastest growth of any major market.

Read more: Coffee Consumption by Country in 2023 and How It Changed Since 2010
AgricultureNewsVivid maps

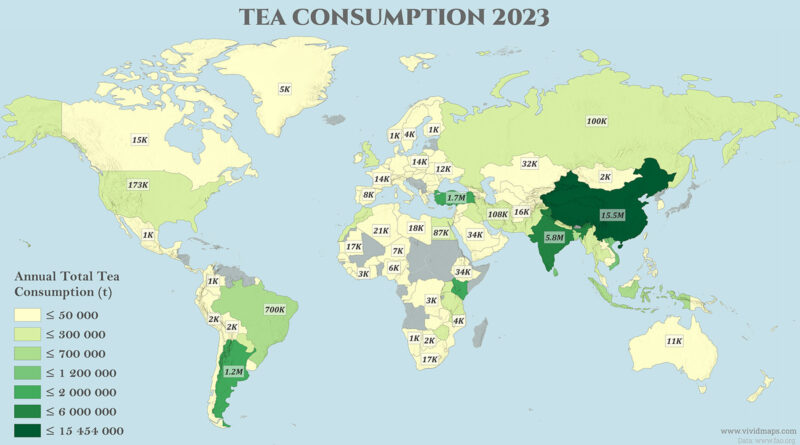
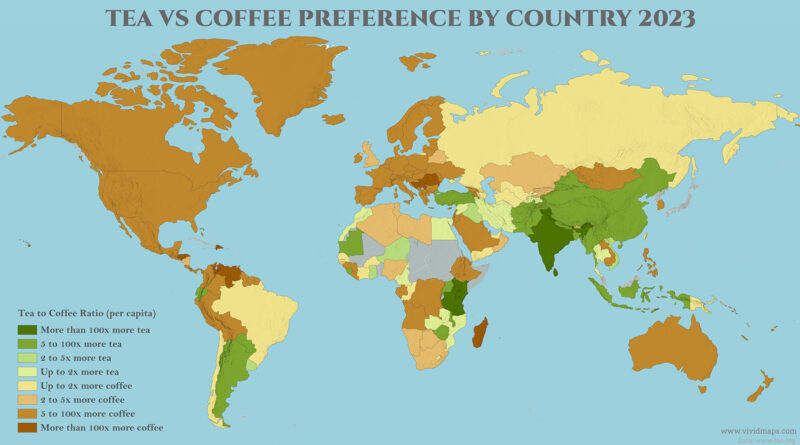
Tea Consumption by Country and How It Changed Since 2010

Global tea and mate supply grew from 11,476 to 33,091 thousand tonnes between 2010 and 2023. China and India together account for about 64 percent of the 2023 total. Sri Lanka leads every country in per capita consumption at 51.69 kg (114.0 lbs) per person. Vietnam and Turkiye posted the sharpest per capita gains of the period.

Read more: Tea Consumption by Country and How It Changed Since 2010
AgricultureNewsVivid maps

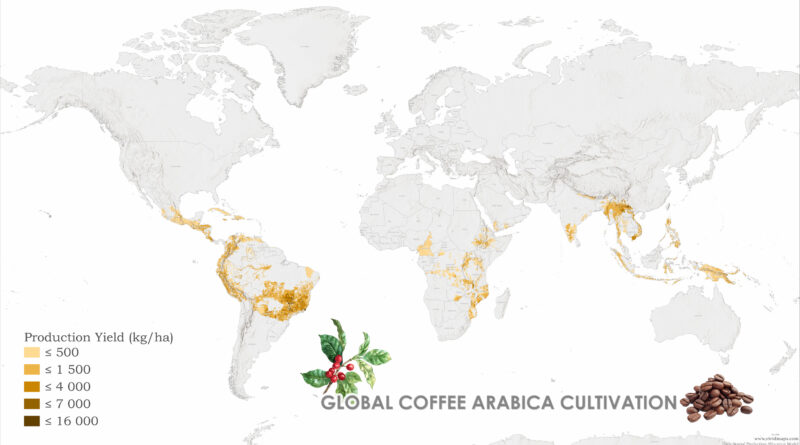
From Highland Peaks to Lowland Valleys: Mapping the World’s Coffee and Tea Territories

Ever wondered why your morning coffee tastes different from your afternoon tea? The answer lies in altitude, climate, and centuries of agricultural adaptation. Join me on a cartographic journey through the landscapes that bring these beloved beverages to your cup.

Read more: From Highland Peaks to Lowland Valleys: Mapping the World’s Coffee and Tea Territories
AgricultureDemography

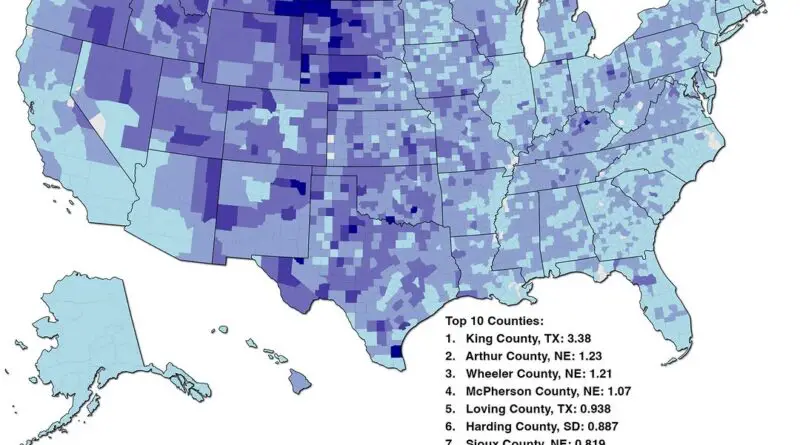
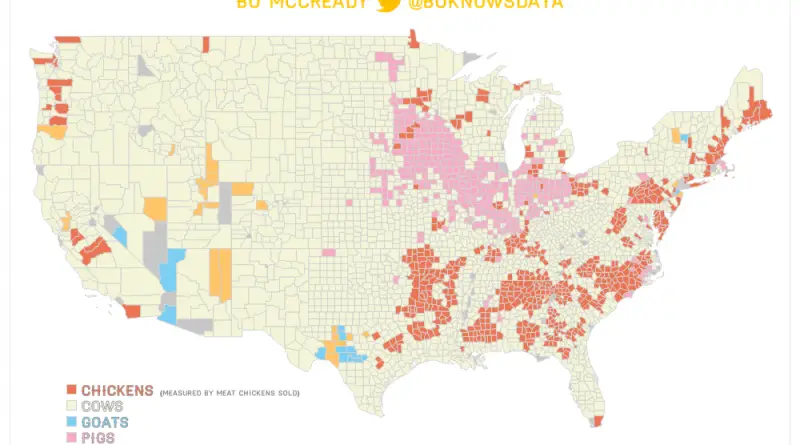
Most Common Domesticated Animal in each US county

In the U.S., the most common domesticated animals vary by region. For example, cattle are prevalent in the Great Plains, while poultry, like chickens, are widespread in the Deep South. An interesting idea by John Johnson suggests adding Homo sapiens to the map as another domesticated animal, supported by the concept of self-domestication in human evolution.

Read more: Most Common Domesticated Animal in each US county