High Injury Network San Francisco Map
The high-injury corridor analysis was conducted by SFDPH in collaboration with SFMTA on behalf of the Citywide Vision Zero Task Force in Fall 2014,
Read MoreThe high-injury corridor analysis was conducted by SFDPH in collaboration with SFMTA on behalf of the Citywide Vision Zero Task Force in Fall 2014,
Read More
Map for Environment combines OpenStreetMap mapping tools with satellite imagery and location data of known logging, industrial agriculture, dam, and
Read MoreNew York City crime map visualizes crime rates using skin colors. NYC Crime maps – New York City felonies map
Read MoreClimatemaps is an interactive map of global monthly mean climate data from land observations between 1961 and 1990. Temperature Precipitation
Read MoreGreen and blue colors represent areas where surface water changes occurred during the last 30 years. Green pixels show where
Read More
People made 1.35 billion journeys on London’s iconic tube network last year. Every weekday, London sees 2 million people commuting
Read More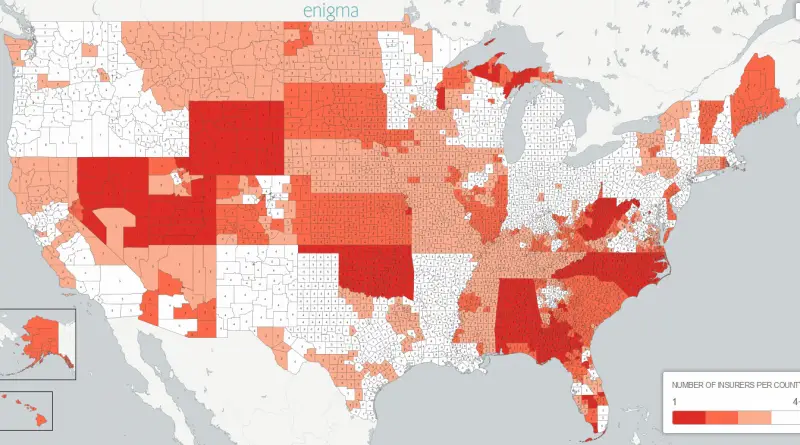
The average United States county would have access to 3.3 insurers in 2017, 18% less than the 4.0 average in
Read MoreVia usgs.gov
Read MoreAs Singapore’s property market cools, more private homes are waiting to be snapped up. A total of 31,362 new units
Read More