Dutch general election results by Municipality (March, 2017)
Source: nw12398 The parties who won seats are as follows: VVD (Volkspartij voor Vrijheid and Democratie – People’s Party for
Read MorePolitical Maps show governmental and administrative borders of countries, provinces, states, and counties, the location of major cities, and other political units.
Source: nw12398 The parties who won seats are as follows: VVD (Volkspartij voor Vrijheid and Democratie – People’s Party for
Read MoreThe Map of Freedom reflects the findings of Freedom in the World 2016, which rates the level of political rights
Read More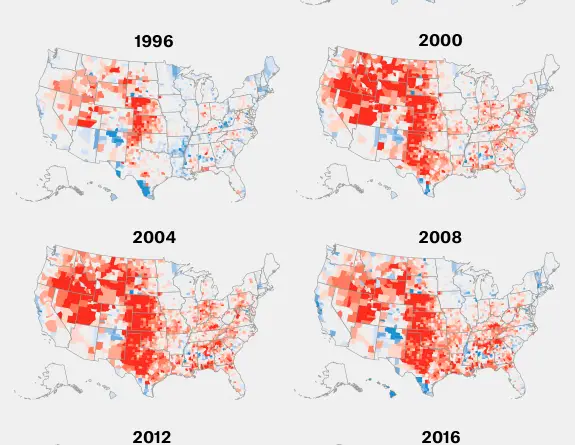
More than 61 percent of voters cast ballots in counties that gave either Clinton or Trump at least 60 percent
Read More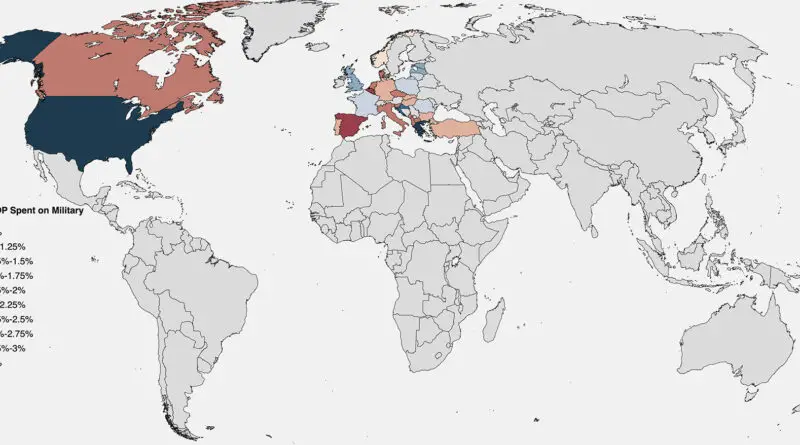
North Atlantic Treaty Organization was formed with 12 founding partners and has added new members 8 times, most recently when North Macedonia entered NATO in March 2020. After accepting their applications for participation in June 2022, Finland and Sweden are expected to become the 31st and 32nd military alliance members.
Read More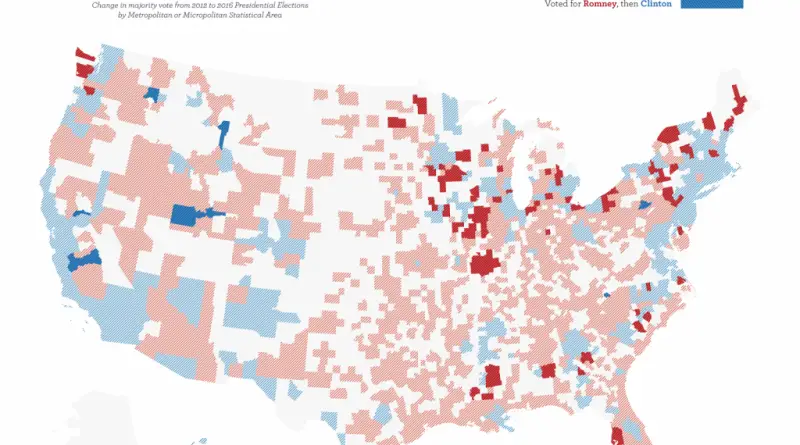
Change in majority vote from 2012 to 2016 Presidential Elections by Metropolitan or Micropolitan Statistical Area. 80 cities that flipped
Read MoreFreedom in the World 2017 evaluates the state of freedom in 195 countries and 14 territories during the calendar year
Read More
The number of signatures on each U.S. state’s petition to secede Reddit user: Jedicobra Percent of state population that voted
Read More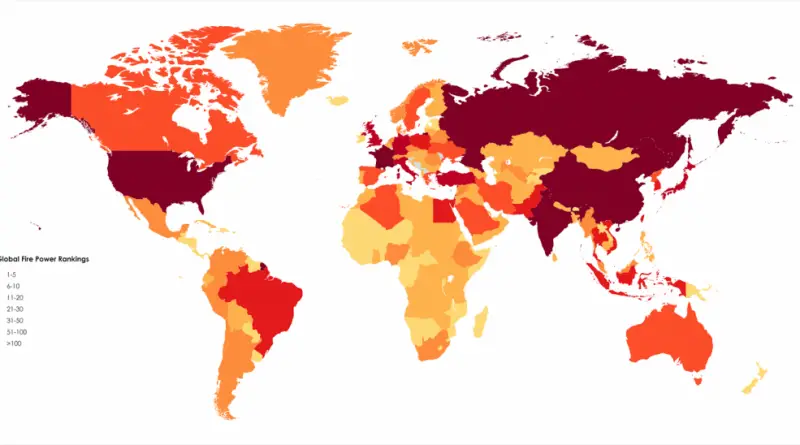
The finalized ranking relies on over 50 factors to determine a given nation’s Power Index score. This allows smaller, though
Read More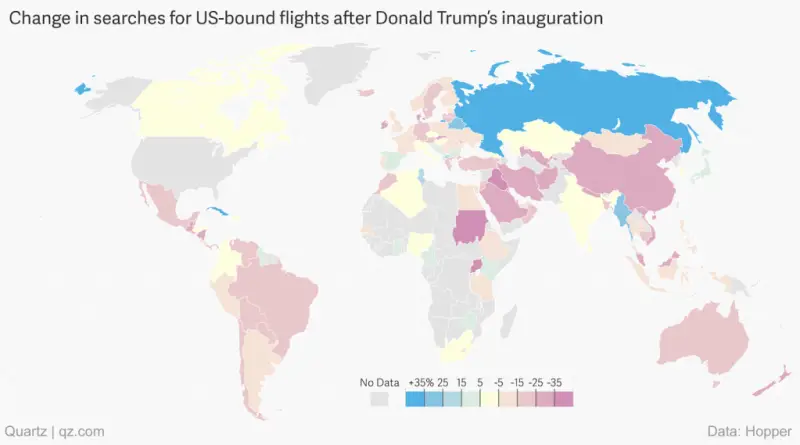
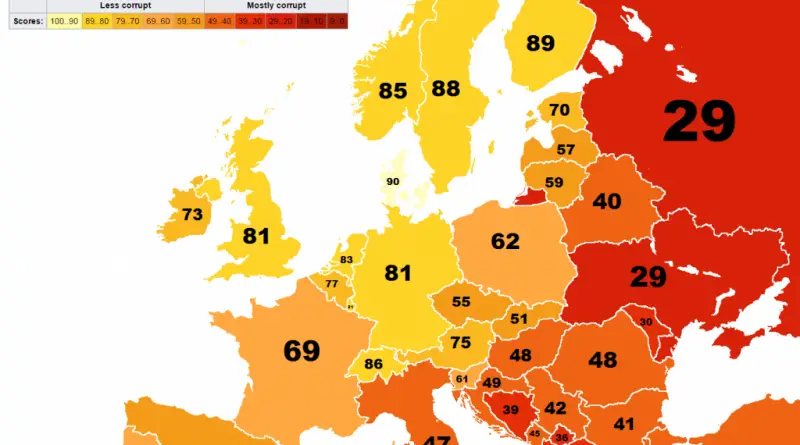
Related post: – Corruption perceptions index (2016)
Read More