Political maps
Political Maps show governmental and administrative borders of countries, provinces, states, and counties, the location of major cities, and other political units.
U.S. Presidential Election results and voting populations (2016)
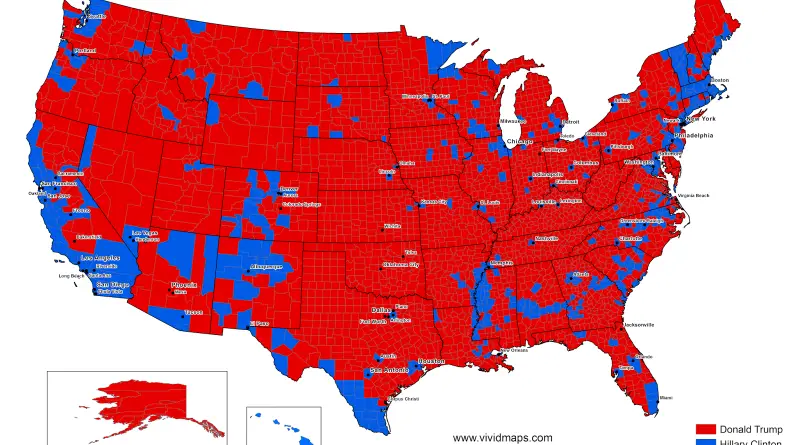
Regular election result map shows who won in which U.S county but didn’t reveal the relative voting populations among each county. It can make people think that every county has an equal population. Moreover, such maps it’s not created to display the margin of victory within each county. It shows who won in a county, even if they won by just one vote.
Read MoreHow the presidential election of 2016 would look like if only millennials voted
STATE DEM % REP % DIFF EV CUSTOM DC 86 4 D+82 3 DC CA 61 18 D+43 55 CA
Read MoreHex map of U.S. electoral votes
Results: Clinton – 218 Trump – 276 Votes: Clinton: 59,163,539 Trump: 59,027,749 Via aljazeera.com Related post: – Electoral Map Upon Trump’s
Read MoreSearching for issues around voting on Nov 9th
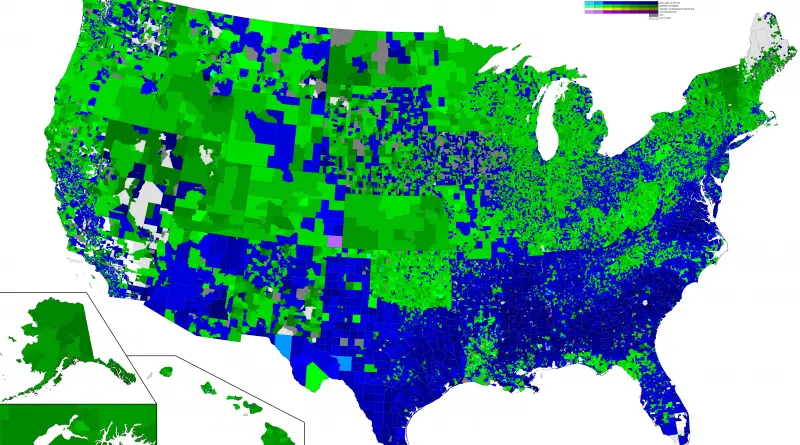
This map shows Google search interest in voting-related issues across the United States at city level. Cities only show up
Read More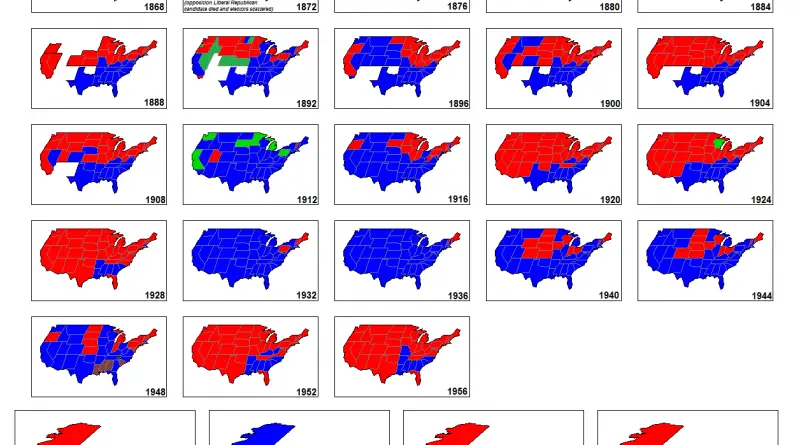
Every United States presidential elections (1788 – 2016)
Source: unknoun. Paler shade = electors chosen entirely or in part by the state legislature and not, or not wholly,
Read More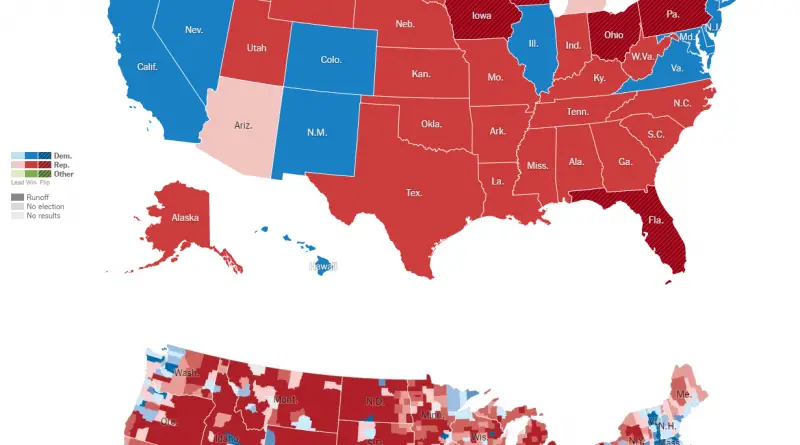
Electoral Map Upon Trump’s Victory
www.nytimes.com 2016 Presidential Election Results InsideGov | Graphiq Election results where states that neither candidate got the majority of votes
Read MoreU.S. Political Donations
www.mapd.com/demos/political-donations/#/dashboard?_k=3d5zxp
Read MoreFirst Candidate for United States President on Ballot Paper By State
Trump – 18 – Arizona – Florida – Georgia – Indiana – Maryland – Michigan – Minnesota – New Mexico
Read More