Spread of people in the United States from 1790 thru 2015
Color represents people per square mile. Line fills represent U.S. territories with no data yet.
Read MoreColor represents people per square mile. Line fills represent U.S. territories with no data yet.
Read MoreSan Francisco Los Angeles New York City
Read More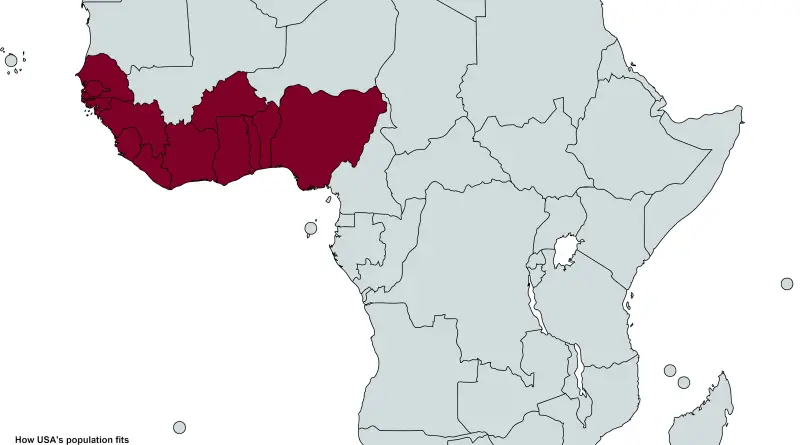
Related posts: – How United States population fits into India – The United States population fits into 4 Chinese provinces
Read More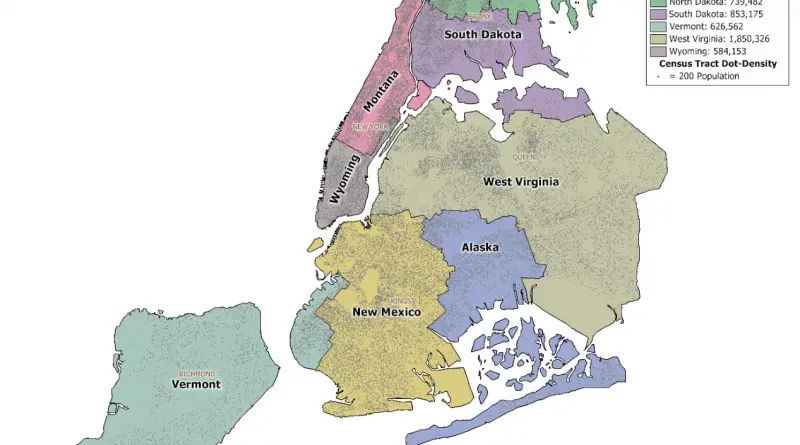
New York City is the most populous city in the U.S., with an approximated population of about 9 million spread over about 303 square miles (784 km2), accounting for over 40% of New York State’s population. New York City is the most densely populated city in the United States and the largest metropolitan area in the world by urban landmass. With nearly 20 million people in its metropolitan statistical area and about 24 million in its combined statistical area, it is one of the world’s most populous megacities.
Read MoreThe map represents the distribution of the population in Finland. A set of random points has been created within the
Read More
“The Hole” is home to around 35600 people across 22000 square miles (about the size of Tasmania or Croatia). For
Read More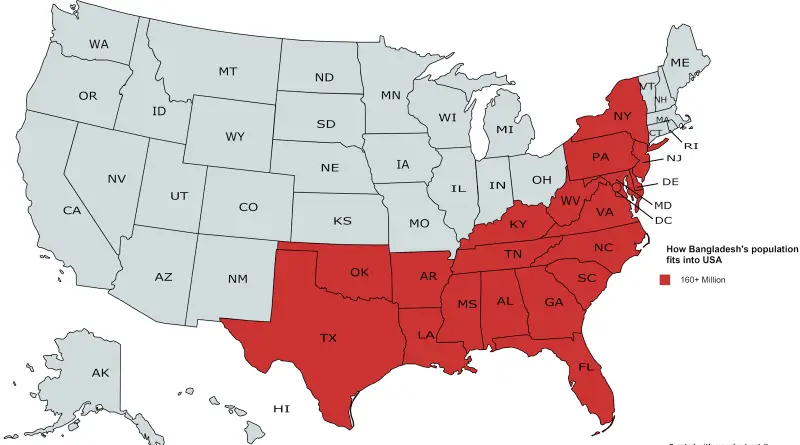
The population density of Bangladesh is 1,265 people per sq km or 3,276 people per sq mi. This South Asian country is the 10th most densely populated country globally. Only tiny countries, Monaco, Macao, Singapore, Hong Kong, Gibraltar, Bahrain, Vatican City, the Maldives, and Malta exceeded Bangladesh’s population density.
Read More