U.S. Population under 5 years of age percent change by county
U.S. Population under 5 years of age percent change by county from 2010 to 2014 U.S. White Non-Hispanic Population under 5
Read More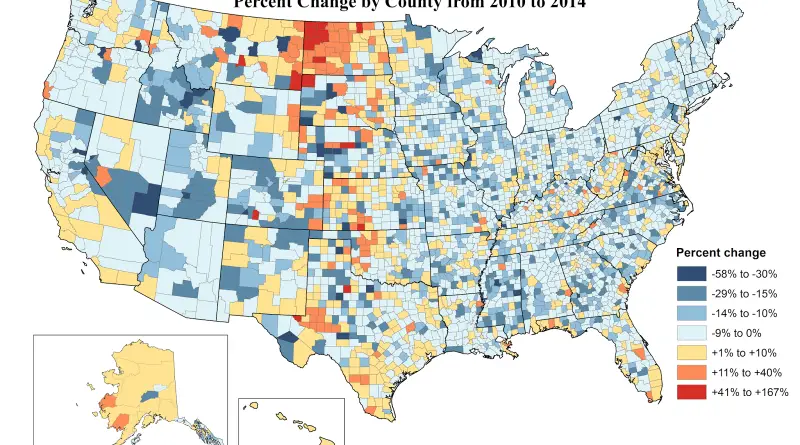
U.S. Population under 5 years of age percent change by county from 2010 to 2014 U.S. White Non-Hispanic Population under 5
Read MoreU.S. Population percent change by county from 2010 to 2014 U.S. White Non-Hispanic population, percent increase by county U.S. Hispanic
Read More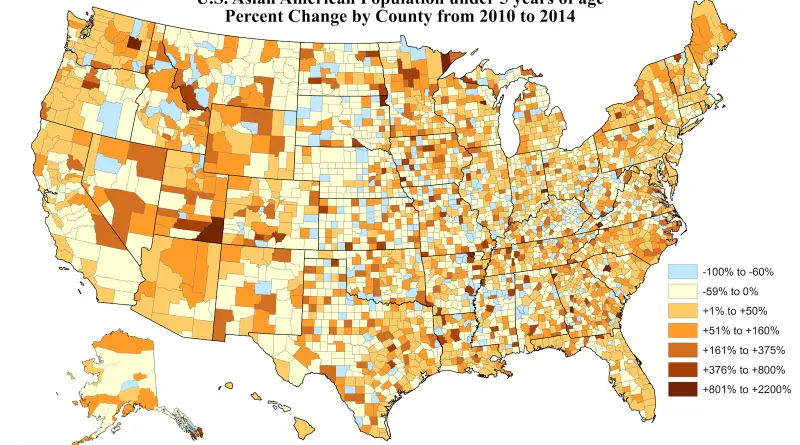
Relates posts: – U.S. Asian American population, percent increase by county – Asian American population percentage by county – Leading
Read More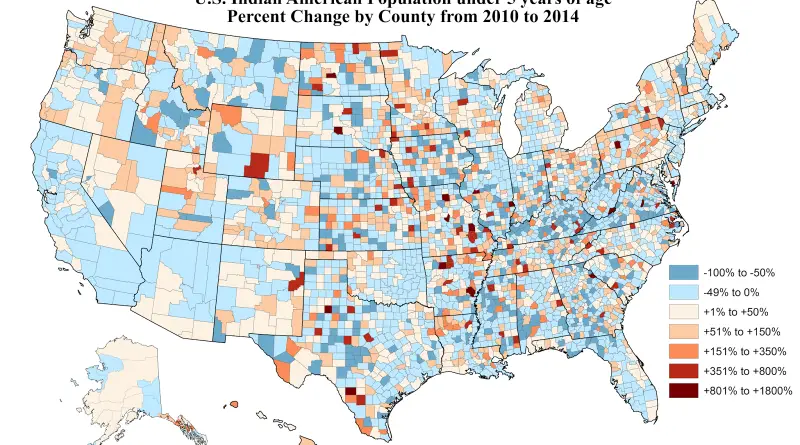
Relates posts: – U.S. Indian American population, percent increase by county – Indian American population percentage by county – Leading
Read More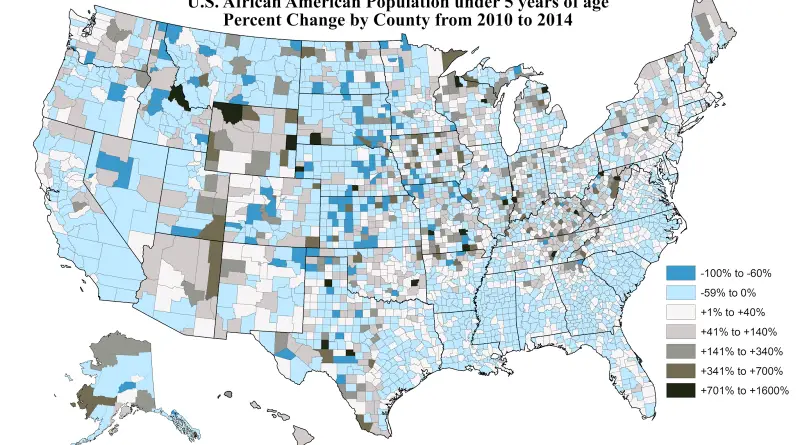
Relates posts: – U.S. African American population, percent increase by county – U.S. population by race – Leading group by
Read More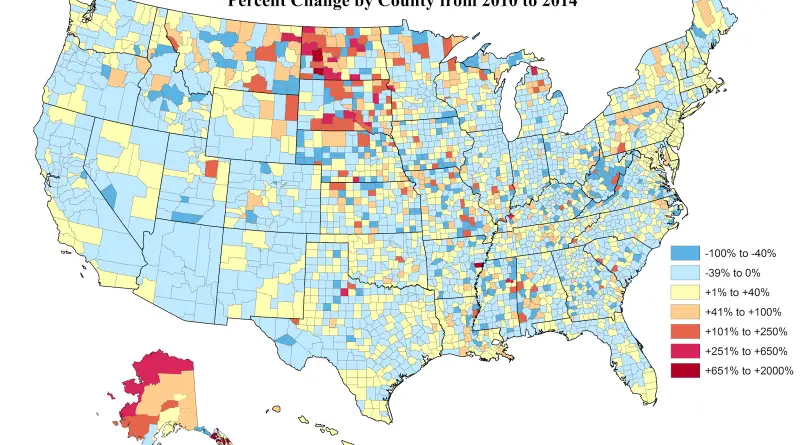
Related posts: – U.S. Hispanic population, percent increase by county – Hispanic population percentage by county – Leading group by U.S. county – Leading
Read MoreRelated posts: – White Non-Hispanic population percentage by county – U.S. Population under 5 years of age percent change by county
Read MoreRelates posts: – U.S. White Non-Hispanic Population under 5 years of age Percent Change by County (2010 – 2014) –
Read More