Transport
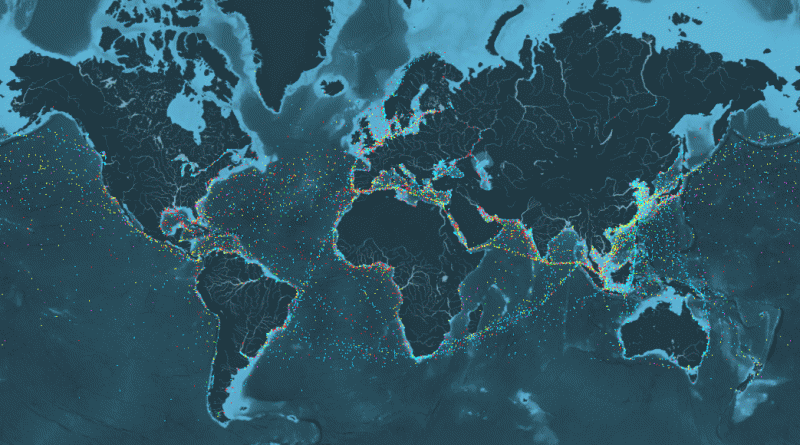
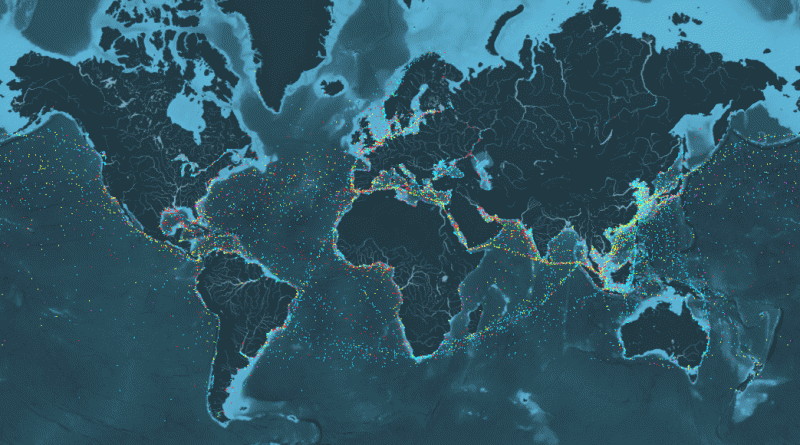
The outlines of continents can be visualized by shipping routes
Related posts: – An incredible visualisation of global shipping traffic – All the ships in the World ocean – Visualizing
Read MoreAn incredible visualization of global shipping traffic
What can I see? You can see movements of the global merchant fleet over the course of 2012, overlaid on
Read MoreAn incredible visualisation of global shipping traffic
What can I see? You can see movements of the global merchant fleet over the course of 2012, overlaid on
Read MoreA day with no metro in Washington
A Day with No Metro: The Metro system shut down for emergency repairs on March 16, 2016. This map visualizes
Read MoreNew York Citi Bike Rebalancing Study
This study focuses on a few of the most intractable problems that any robust bikeshare network faces: rebalancing stations so
Read MoreBicycle Stress Map
This map shows the levels of traffic stress that people who bicycle experience on each public road (excluding freeways) and
Read More

