Counties with fewer than 25 black Americans (2010 – 2014)
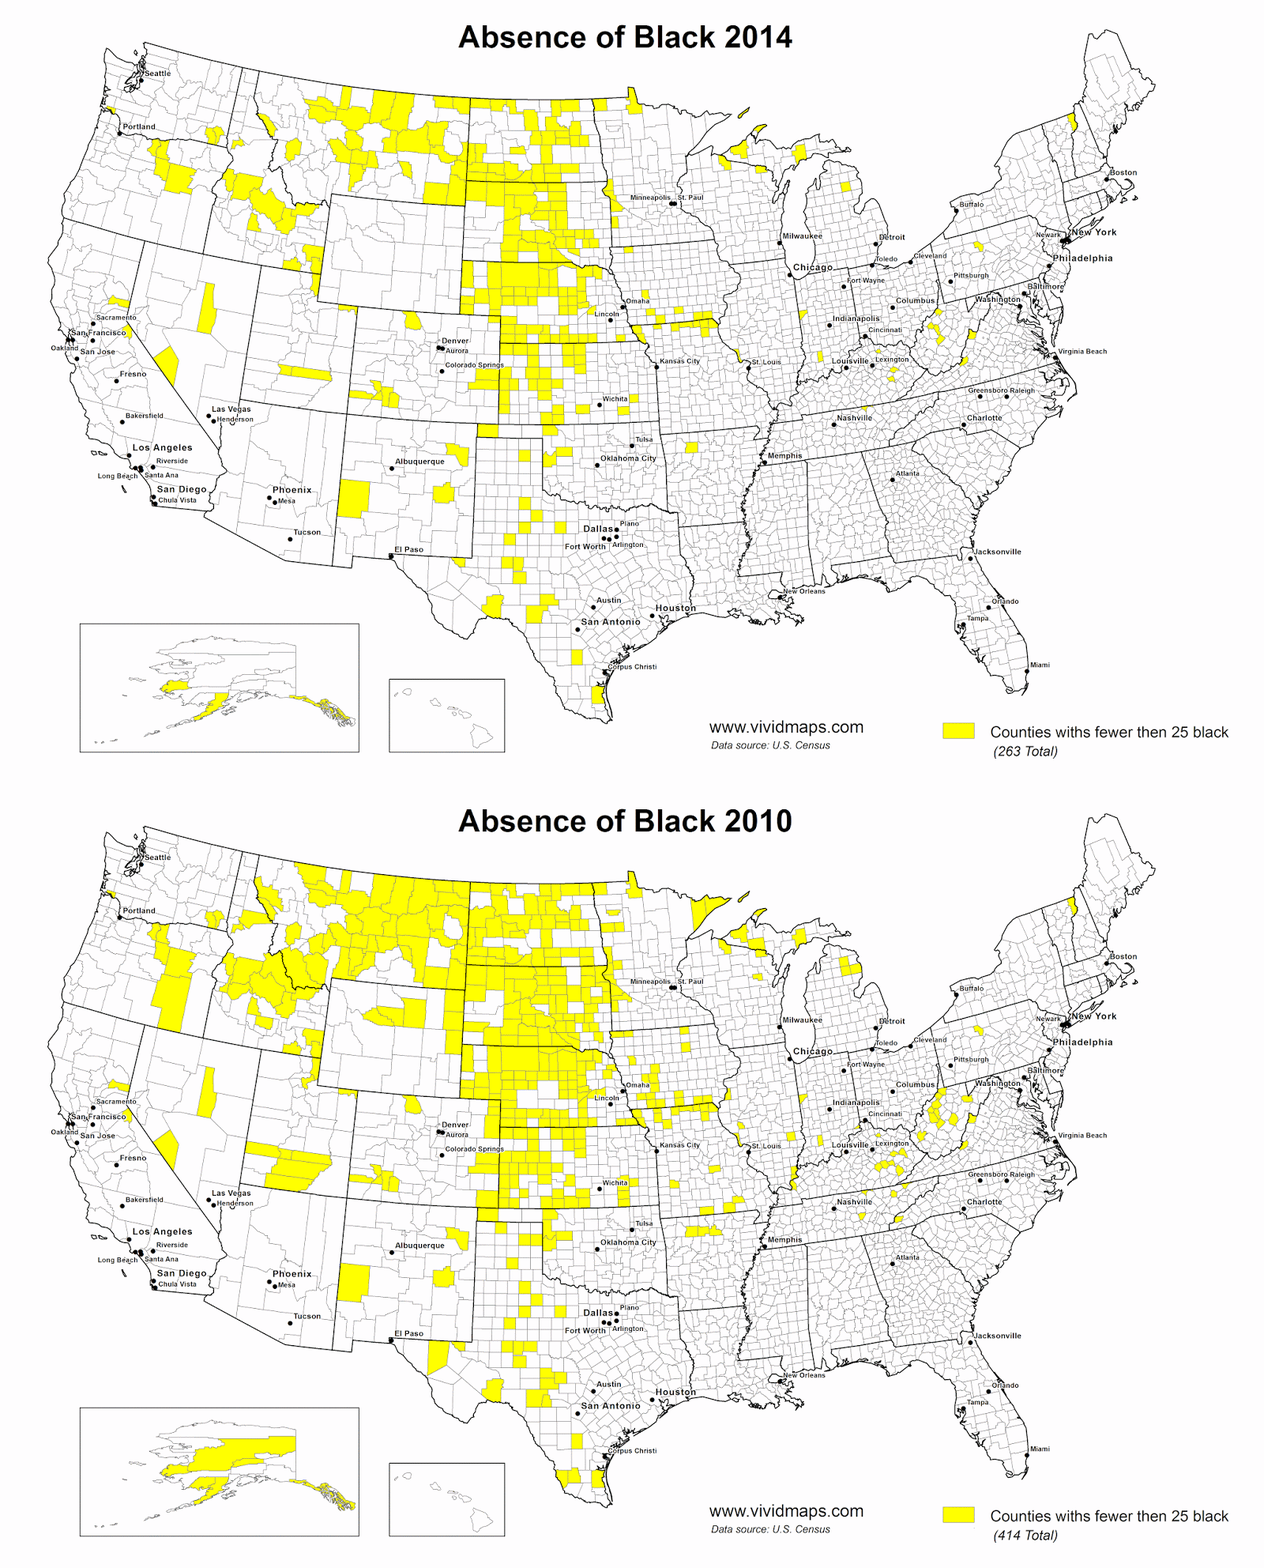
Counties with fewer than 25 black Americans, 2010
Counties with fewer than 25 black Americans, 2014
Related posts:
– Counties with fewer than 25 asian Americans (2010-2014)
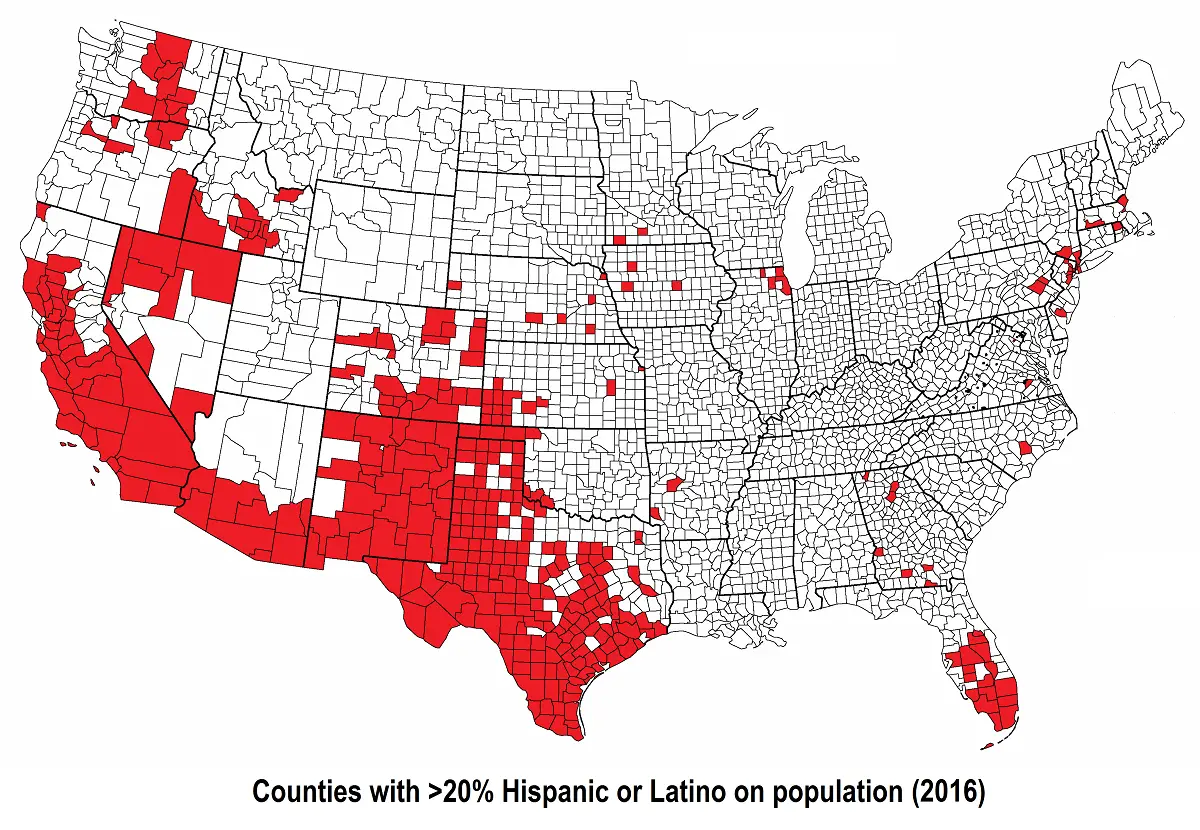
– Counties with fewer than 25 hispanic Americans (2010-2014)
– African American population percentage by county
– U.S. African American population, percent increase by county
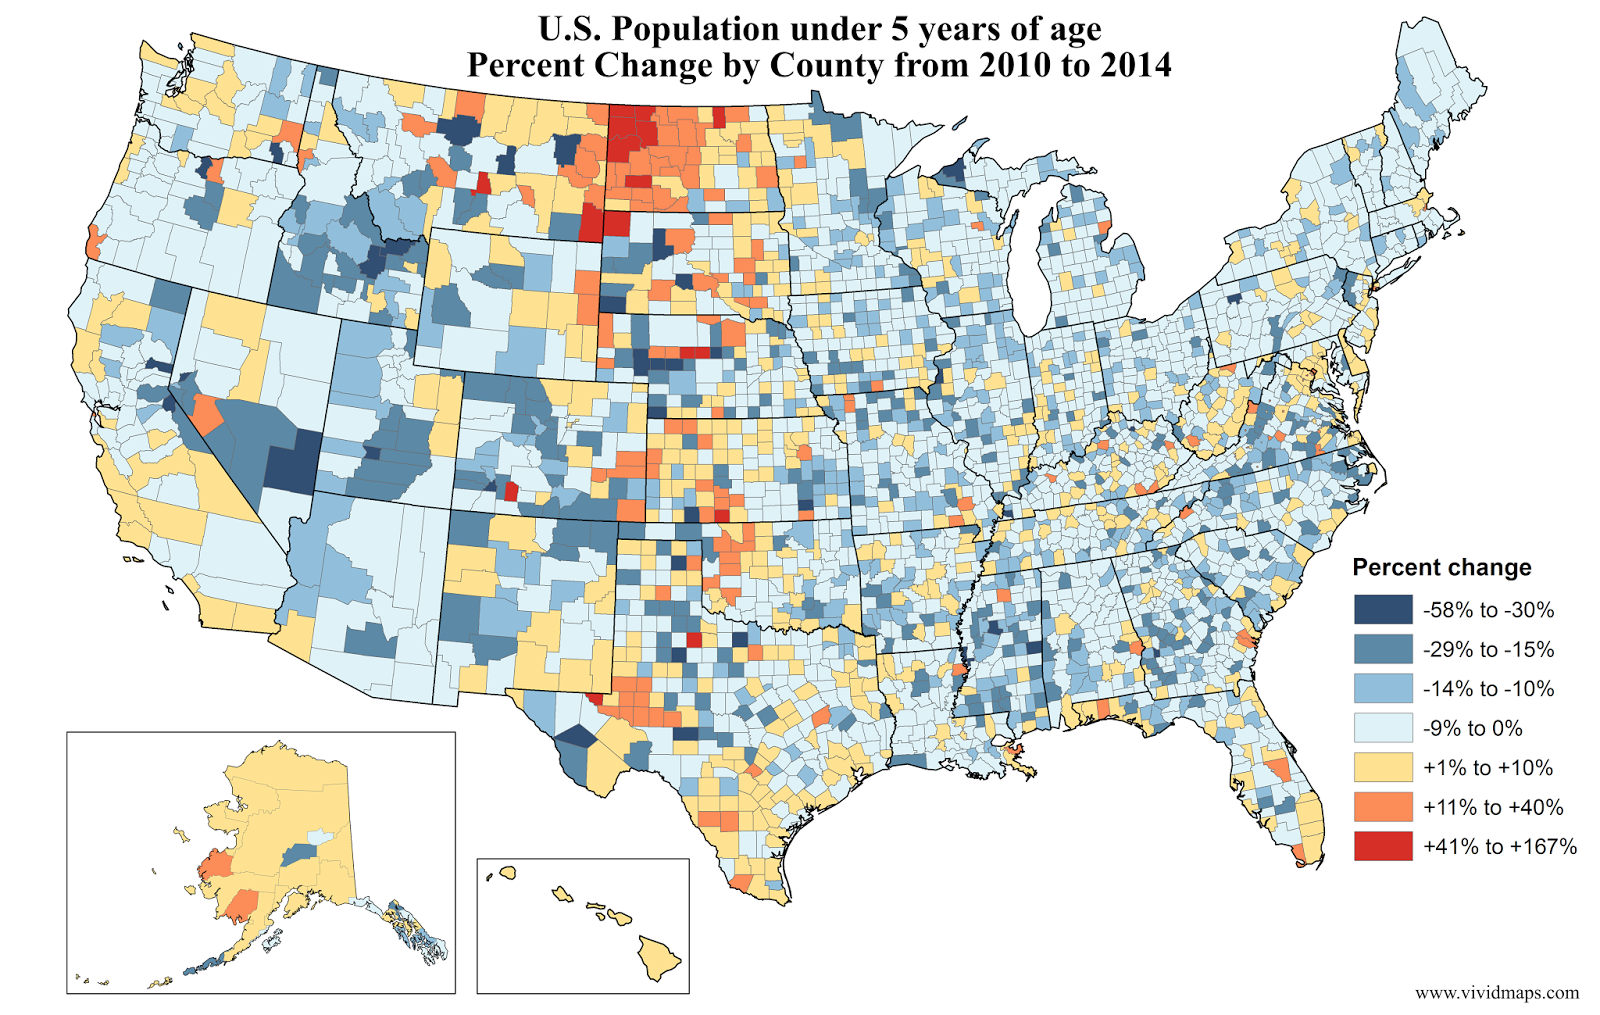
– U.S. African American Population under 5 years of age Percent Change by County (2010 – 2014)
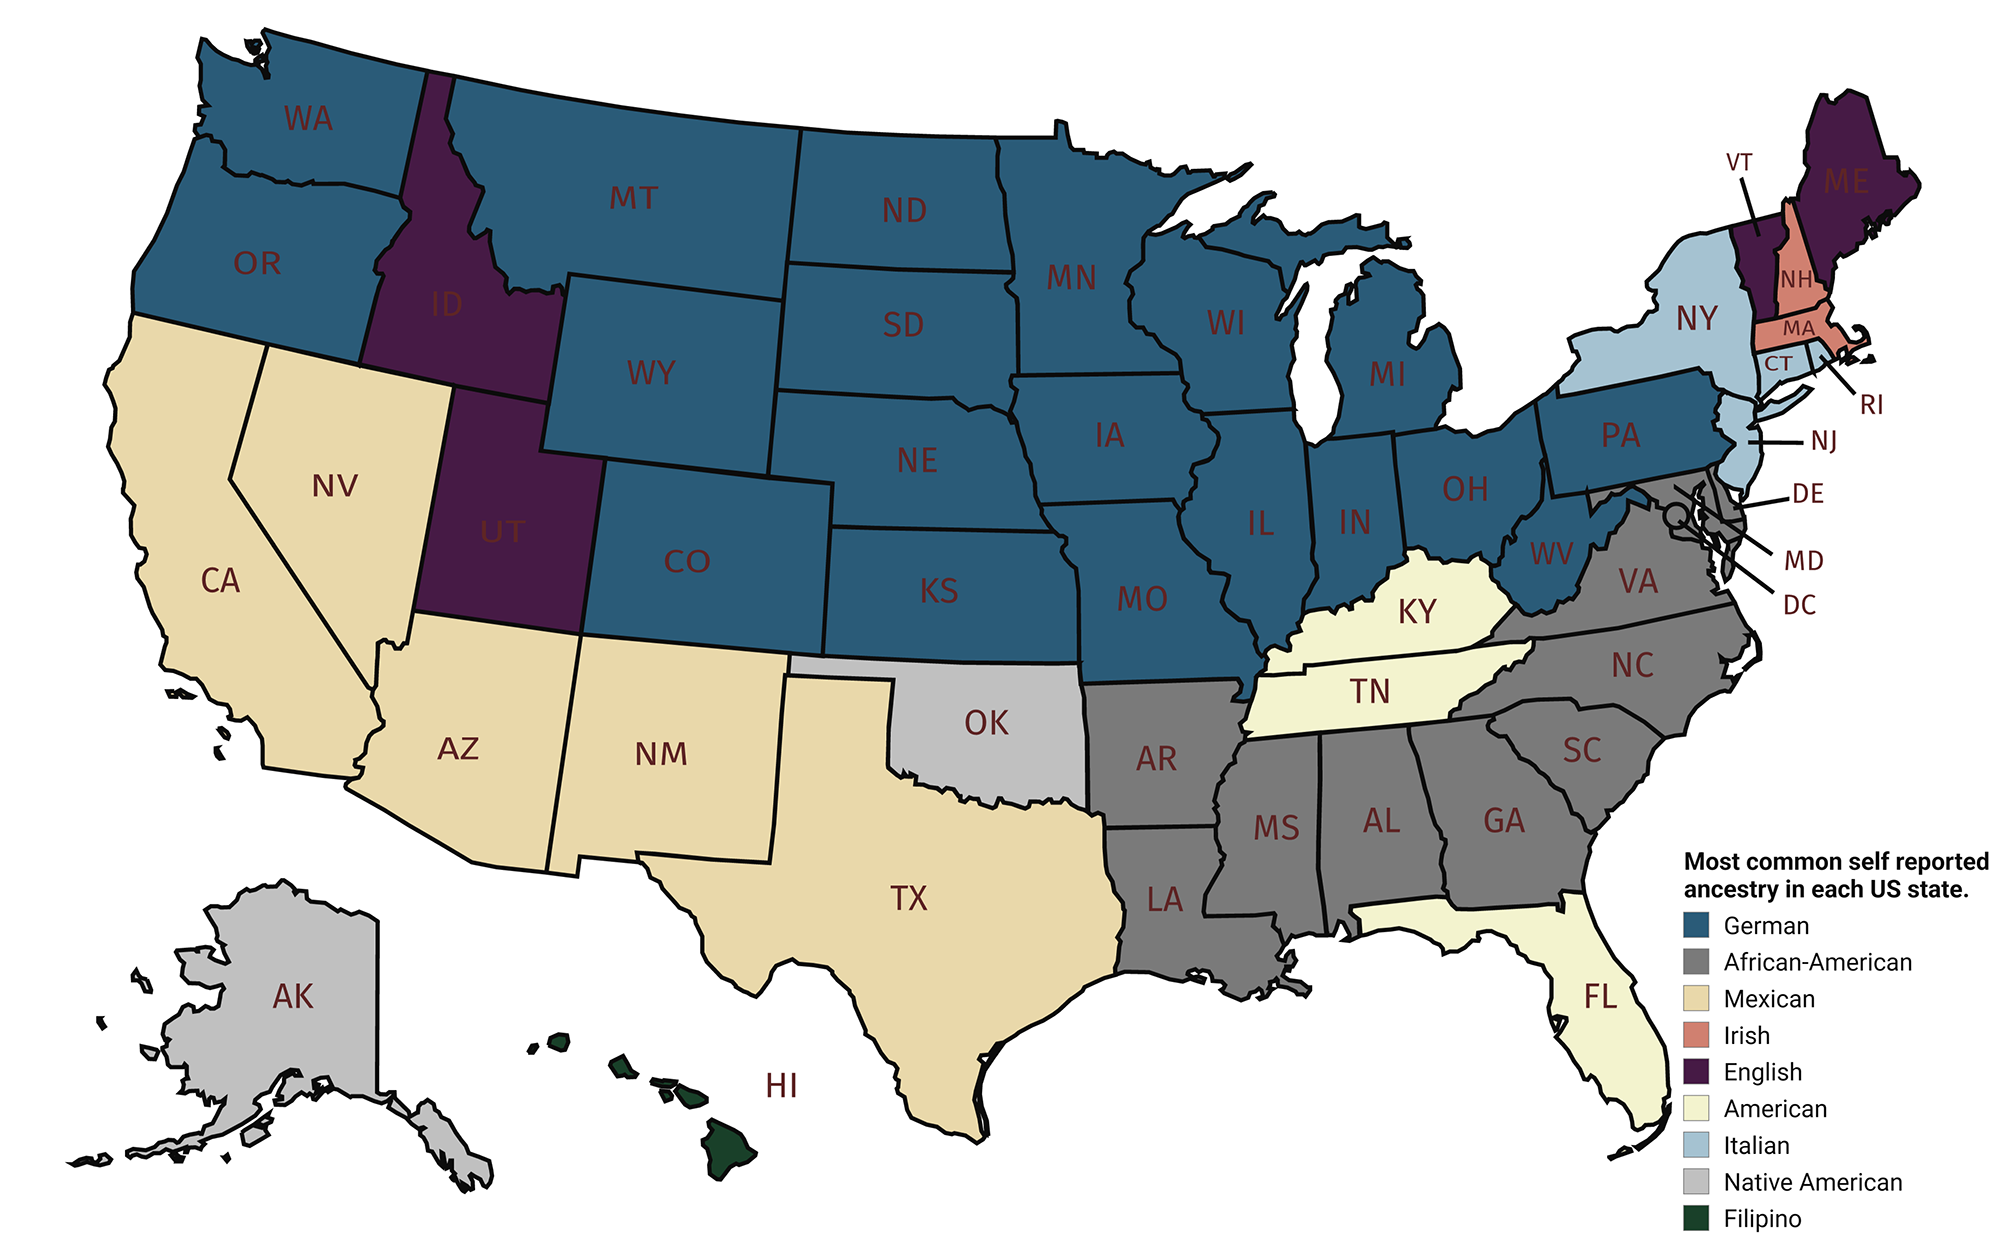
– Leading group by U.S. county
– Leading minority group by U.S. county




Given the high rates of imprisonment of blacks since 1980 – which has probably had profound political effects by preventing the development of a mass radical left party (politically like the WSWS) whom most of the inner city black felons and ex-felons would have supported, the following map of counties with fewer than 25 actual black households may be far more useful:
I have also compiled a comparative figure for the 1970 Census, by which time white America had tried for over two centuries to create effectively a “white cloister” against a hostile outside world of mob democracy and equality of result:
It’s notable that there are fewer counties with so few black households in 2010 than in 1970, although it can be argued that the political divergence of the rural “white cloister” from urban areas will reverse this trend.
Great job!