Mapping the Rise: Hispanic and Latino Americans Reshape the U.S. Landscape
The Changing Face of America: Hispanic and Latino Population Growth
Hispanic and Latino Americans represent a diverse group, encompassing people with heritage from Spain, Mexico, the Caribbean, Central America, and South America. This ethnic group has become an integral part of the American fabric, contributing to the nation’s culture, economy, and society in countless ways.
As of 2022, the U.S. Census Bureau estimated that there were approximately 63.7 million Hispanic and Latino Americans, accounting for about 19.1% of the total U.S. population. This marks a significant increase from just 50.5 million (16.3%) in 2010, highlighting the rapid growth of this demographic group.
The American demographic landscape is changing rapidly, and one of the most striking trends is the expansion and growing influence of the Hispanic and Latino population. Our new maps, created using ArcGIS and the latest U.S. Census data, tell a compelling story of this demographic shift.
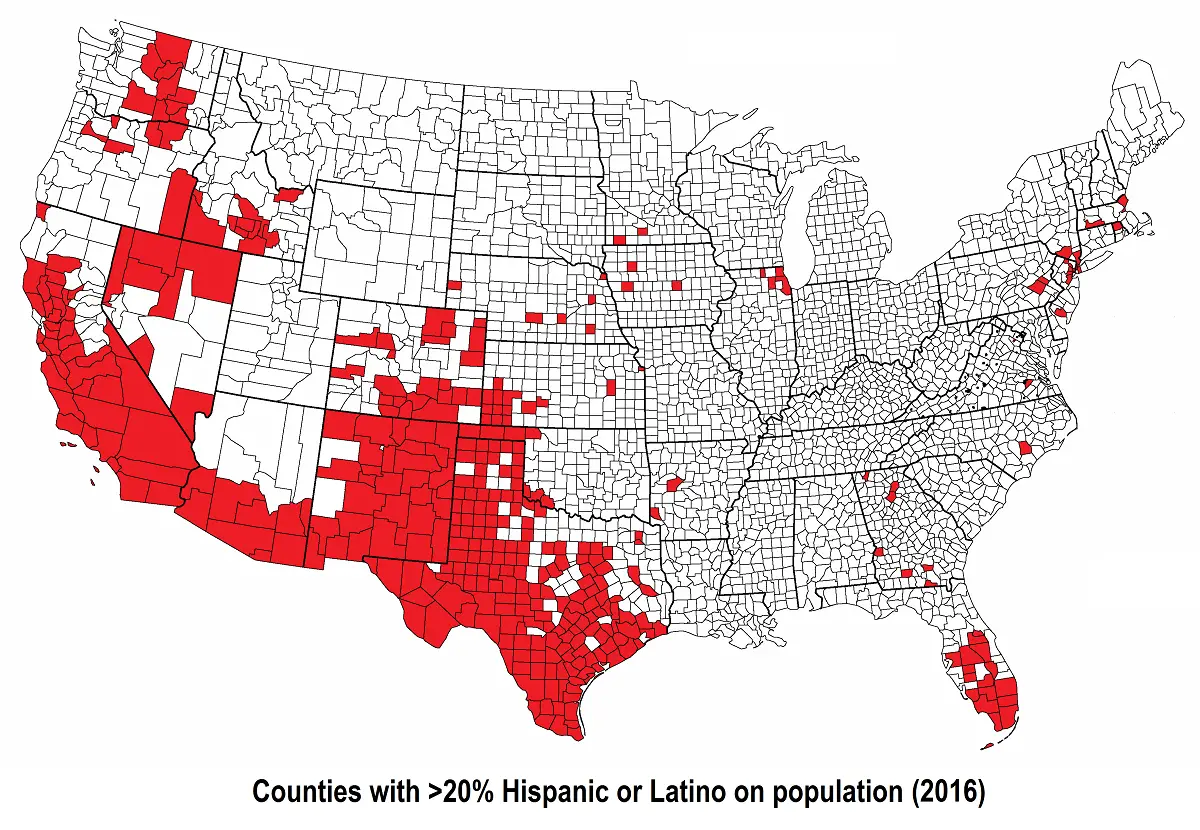
This animated map shows the distribution of Hispanic and Latino populations across U.S. counties, with thresholds ranging from 1% to over 95%. As the animation progresses, we see not only the areas with historically significant Hispanic presence but also emerging regions where these communities are putting down new roots.
Key Observations:
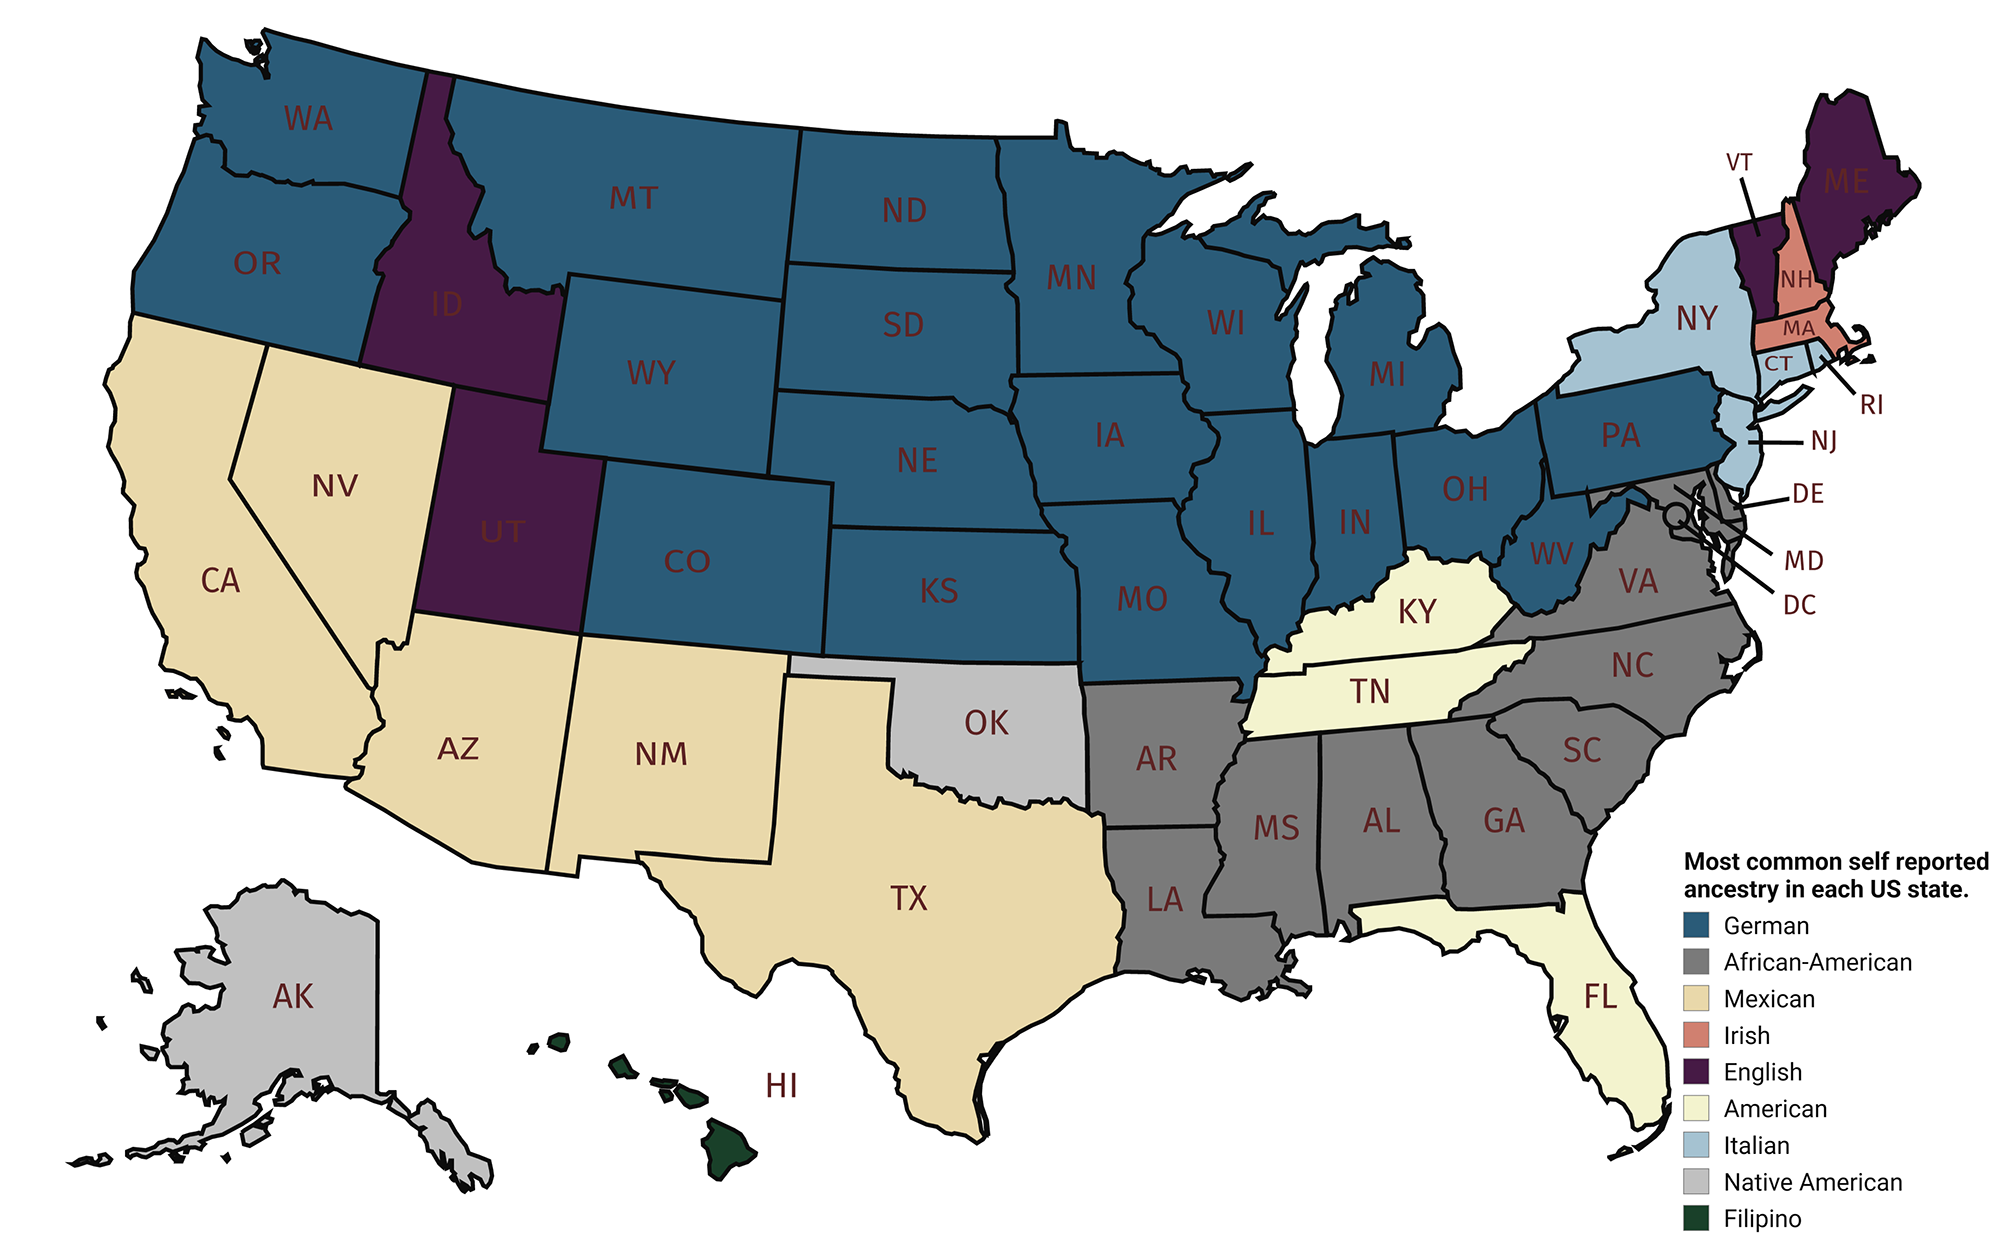
- Southwestern Stronghold: States like California, Texas, Arizona, and New Mexico consistently show high concentrations of Hispanic and Latino residents, reflecting historical settlement patterns and proximity to Latin America.
- Emerging Hubs: We see growing Hispanic populations in unexpected areas, such as parts of the Midwest and Southeast, indicating new migration patterns and changing economic opportunities.
- Urban Centers: Major metropolitan areas across the country show significant Hispanic and Latino presence, highlighting the role of cities as cultural melting pots.
The Long View: Hispanic Majority Counties (1990-2022)
Our second map takes a longer historical perspective, tracking counties where Hispanics and Latinos comprise over 50% of the population from 1990 to 2022. This time-lapse visualization offers several intriguing insights:
- Steady Expansion: The number of Hispanic-majority counties has grown consistently over the past three decades, particularly in the Southwest and along the U.S.-Mexico border.
- New Frontiers: We see the emergence of Hispanic-majority counties in unexpected regions, suggesting a broadening geographic distribution of the Hispanic population.
- Urban to Rural Shift: While major cities have long been centers of Hispanic culture, we observe a trend of increasing Hispanic populations in more rural counties, particularly in agricultural areas.
Looking to the Future: Projections and Implications
The growth of the Hispanic and Latino population in the U.S. shows no signs of slowing. According to the Pew Research Center, Hispanics are projected to reach 29% of the U.S. population by 2050, up from 19% in 2020. This growth is driven by both immigration and higher birth rates among Hispanic Americans compared to other demographic groups.
Several factors will shape the future distribution and impact of the Hispanic population:
- Economic Opportunities: As industries evolve and relocate, Hispanic workers may follow, potentially creating new population centers.
- Education: Increasing college attendance rates among Hispanic youth may influence professional opportunities and geographic mobility [2].
- Political Engagement: Growing Hispanic populations in various regions may reshape local and national political landscapes.
- Cultural Integration: As Hispanic communities become more established across the country, we may see increased cultural exchange and blending with other American traditions.
The Broader Context: Diversity in the United States
While our maps focus on Hispanic and Latino populations, it’s crucial to view this trend within the broader context of American diversity. The United States continues to become more multicultural, with various ethnic groups contributing to the nation’s rich cultural mosaic.
As we look at these maps, it’s important to remember that they represent more than just statistics. Each data point reflects communities, families, and individuals who are integral to the American story. The changing demographics highlighted in our visualizations underscore the dynamic and evolving nature of American society.
For those interested in exploring more detailed maps of the United States, we recommend checking out these high-quality options available on Amazon:


