How El Niño Flips the World’s Rainfall Map
Earth’s climate is driven by a continuous interaction between ocean, atmosphere, and the uneven distribution of solar energy across the planet’s surface. Few phenomena make that interaction as visible as El Niño and La Niña — two phases of the same Pacific oscillation that periodically redraw the global rainfall map across six continents at once. Right now, that redrawing is underway. NOAA’s Climate Prediction Center estimates the probability of a very strong El Niño event at 63% for the November 2026 to January 2027 window. Some climate models go further. Ensemble runs from multiple forecasting centres suggest this could become the strongest El Niño in modern history, potentially surpassing the record-breaking 1877-1878 event.
Understanding what that means for global precipitation starts with the ocean current system that makes the tropical Pacific so influential.
The current system behind the cycle
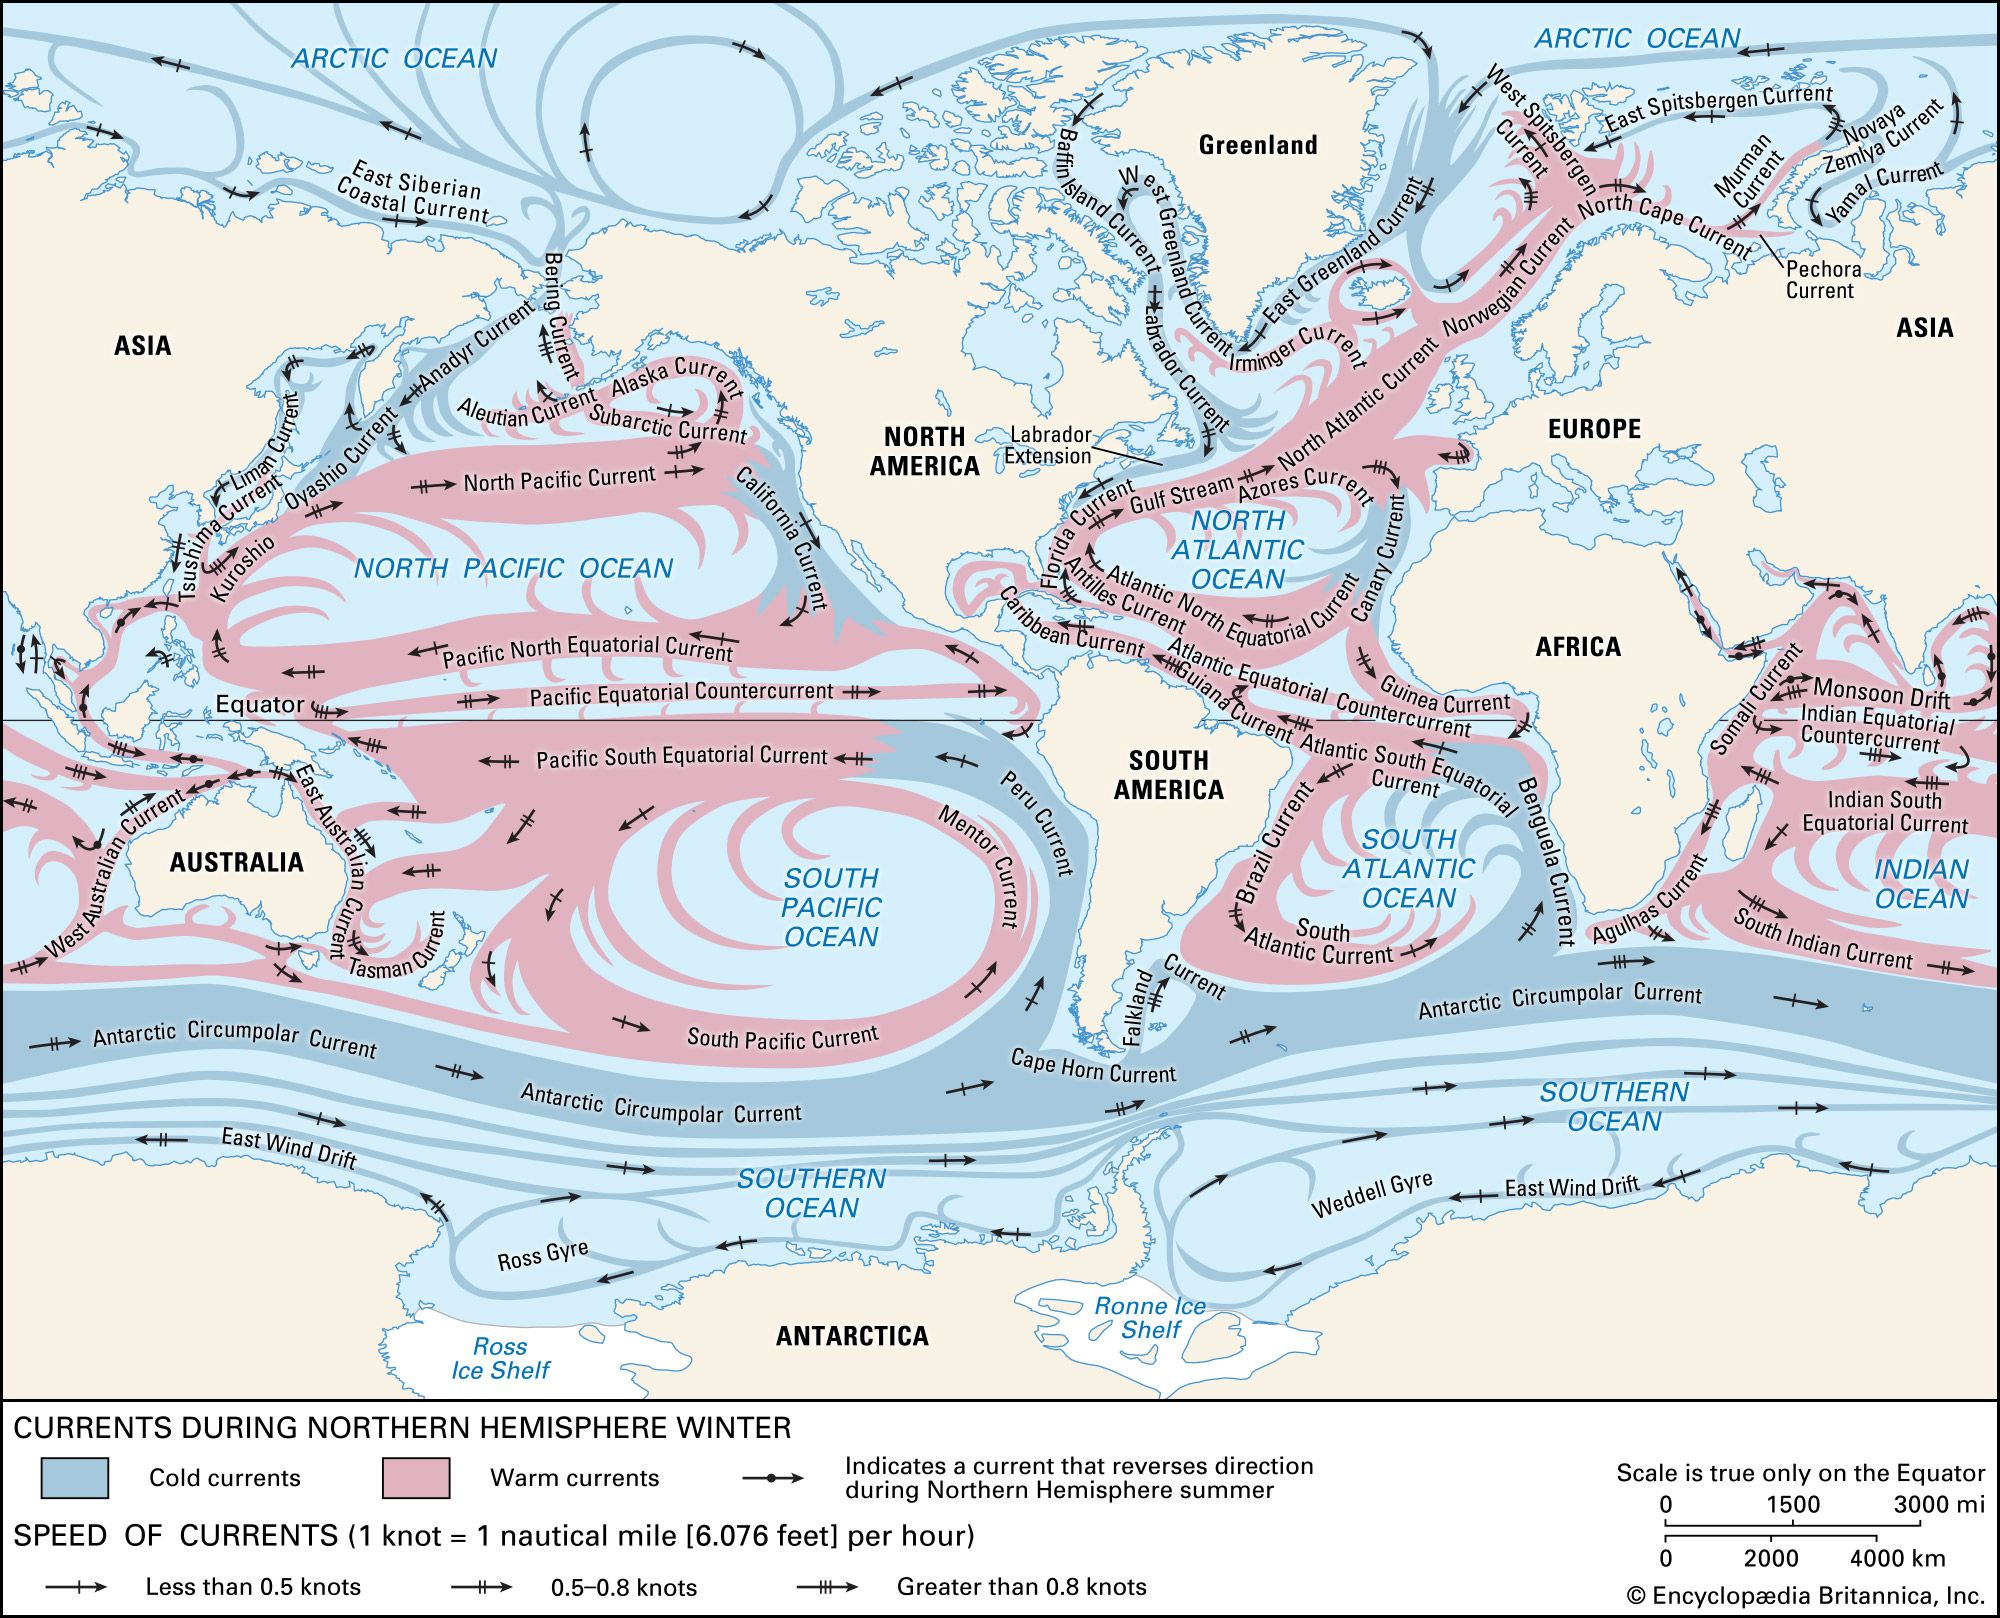
The Britannica map below shows how global ocean circulation is organised. These current systems play an important role in determining the climates of coastal regions, transferring heat from Earth’s equatorial areas toward the poles much the way atmospheric winds do. In the Southern Hemisphere, gyre circulation runs counterclockwise, generating eastern boundary currents along the western coasts of continents. Both the Peru (Humboldt) Current off South America and the Benguela Current off western Africa draw cold water northward from the Antarctic Circumpolar Current.
Peru lost over USD 1.4 billion in fishmeal and fish oil exports when its 2023 anchovy season was cancelled. Around 18,000 fishermen went nine months without income. The trigger was a shift in the central Pacific, not anything happening off the Peruvian coast. The Peruvian anchovy fishery is the largest in the world in terms of catches, and its productivity sits entirely on cold water rising from depth to the surface. When the easterly trade winds along the equator weaken, the warm water piled up in the western Pacific sloshes eastward and sea surface temperatures in the central and eastern Pacific spike. Cold upwelling slows. The anchoveta lose their food source.
NOAA tracks this through the Walker Circulation, a massive east-to-west air flow driven by pressure differences between the warm western and cool eastern Pacific. Its breakdown is what triggers El Niño. La Niña is the opposing state: cooler-than-normal sea surface temperatures in the same region, paired with stronger-than-normal easterly winds. The two phases alternate every two to seven years.
How rainfall shifts by region
El Niño affects rainfall far beyond its Pacific origins. One of its less obvious effects is on Atlantic hurricanes: high-altitude wind shear increases over the Atlantic, suppressing storm development. Colorado State University cut its 2026 Atlantic hurricane forecast to just 11 named storms, predicting activity around 60% of the long-term average. Caribbean and Central American wet seasons, which depend heavily on tropical systems, see the knock-on effect of that suppression.
The drought signal reaches further still. Australia has seen its worst droughts on record in El Niño years, 1982, 1994, 2002, 2006, and 2015, with total winter crop production falling 40% and farm GDP declining by an average of 13%. Indonesia loses monsoon rainfall. Parts of southern Asia see suppressed precipitation across the same season.
Above-normal rainfall during El Niño tends to fall across the Horn of Africa, parts of southern South America, central Asia, and the southern United States. East Africa complicates any simple summary. El Niño often intensifies the October to December short rains season there, yet suppresses rainfall from June through September across Sudan, South Sudan, parts of Ethiopia, and western Kenya.
La Niña brings increased chances of unusually wet conditions to Southeast Asia, Australia, northern South America, and Melanesia, and southern Africa often receives above-normal rainfall during this phase. Drought risk under La Niña migrates toward East Africa, parts of Central Africa, and subtropical North America.
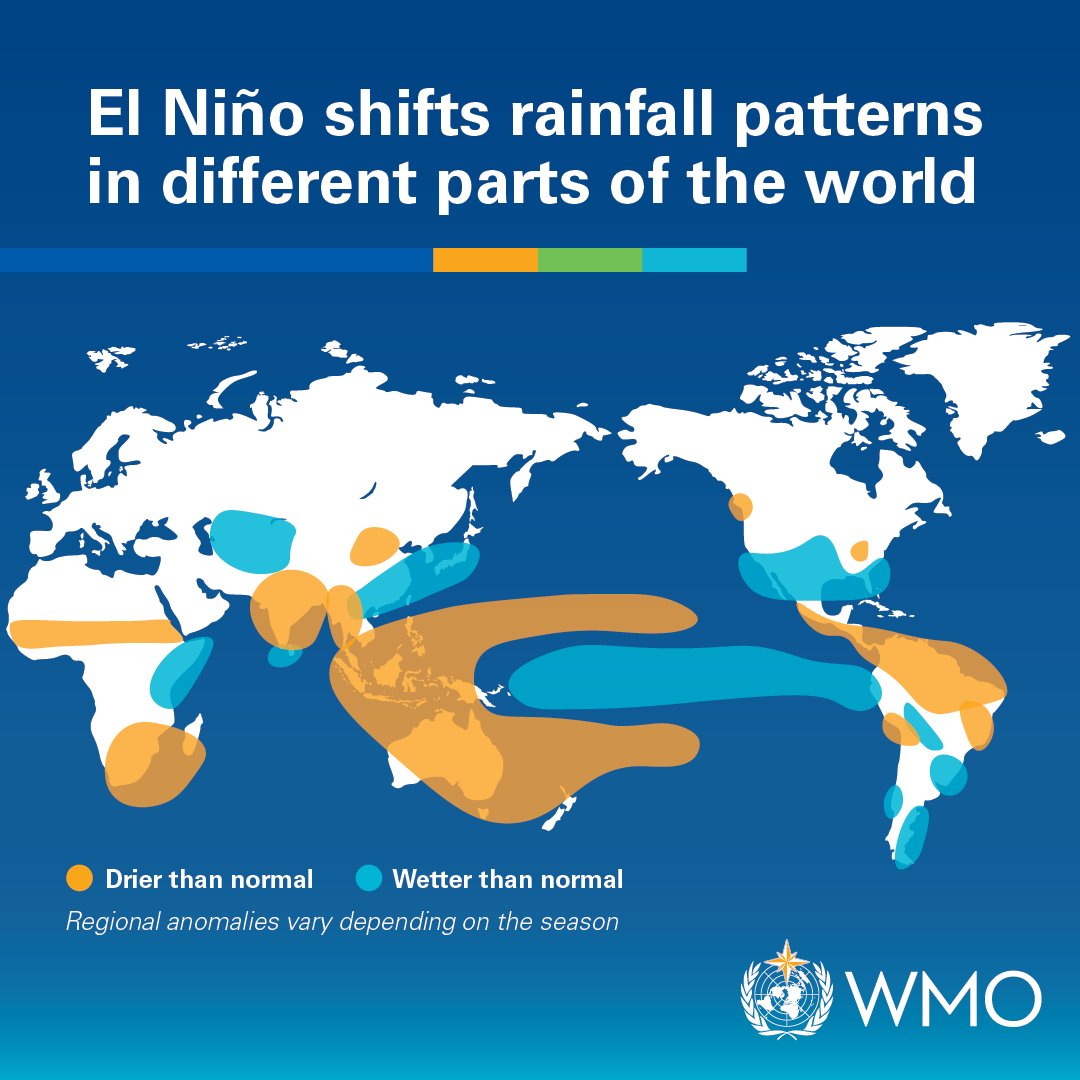
The WMO map above plots these anomalies season by season: orange for drier than normal, blue for wetter. Each season gets its own panel because a region showing orange in one quarter can be neutral or blue a few months later within the same El Niño–Southern Oscillation (ENSO) event.
| Phase | Wetter than normal | Drier than normal |
|---|---|---|
| El Niño | Southern South America, southern US, Horn of Africa, central Asia | Australia, Indonesia, Central America, northern South America, Caribbean, parts of southern Asia, southern Africa |
| La Niña | Southeast Asia, Australia, northern South America, Melanesia, southern Africa | East Africa, parts of Central Africa, subtropical North America, southeastern South America |
What climate change adds
ENSO predates the industrial era by millennia. According to WMO, there is no evidence that climate change increases its frequency or intensity. What it changes is what each event produces once it arrives. Climate change cranks up the volume because each El Niño now unfolds in a much hotter and more energetic world due to fossil fuel pollution.
Imperial College London researchers found that El Niño-driven sea surface temperature extremes have already intensified by around 10% compared to pre-1960 levels, with earlier modelling from the same group suggesting extreme events could double in frequency over the next century. 2024 became the hottest year on record through the combination of the 2023-2024 El Niño and human-induced climate change from greenhouse gas emissions. WMO estimates an 86% probability that at least one year between 2026 and 2030 will surpass it. With a potentially stronger event now confirmed for 2026-27, that timeline may be short.


?")

