High speed rail in Eastern Asia (2017)
Reddit user: AJgloe The greatest length of high-speed railways is in China. In the Asian part of Russia, there are
Read More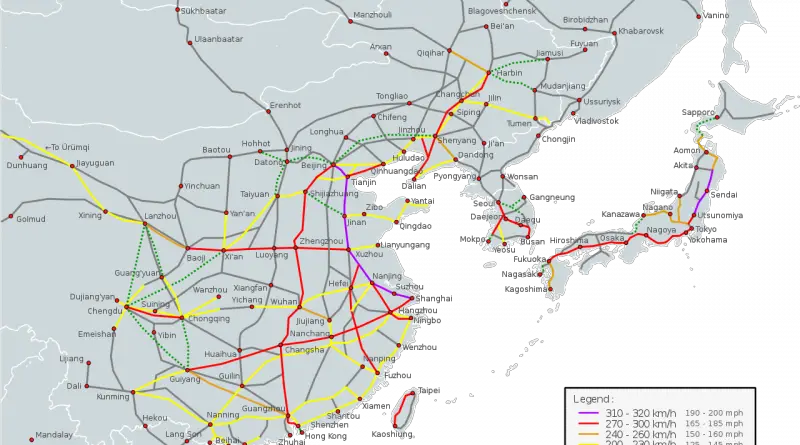
Reddit user: AJgloe The greatest length of high-speed railways is in China. In the Asian part of Russia, there are
Read MoreRelated post: – Find cities with a similar climate
Read More
The United Kingdom has created some of the biggest names in music. From classic rock ‘n’ roll to grime, there’s
Read More
This map below shows the weekly vaccination rate of at least one dose of any vaccine. The data are animated
Read MoreVia us-climate An urban heat island is a metropolitan area that is significantly warmer than its surrounding rural areas due
Read More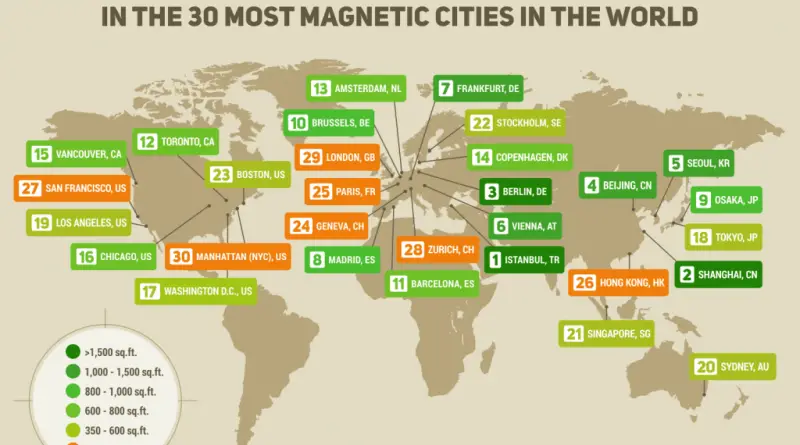
How much space (sq.ft.) one can rent for $1,500 based on the average price per square foot? 1. Istanbul, TR
Read MoreThe European natural gas network is a complex and interconnected system of pipelines and infrastructure that facilitates the transportation and distribution of natural gas across Europe. This network is essential for ensuring a stable supply of natural gas to meet energy demands in various countries and regions.
Read More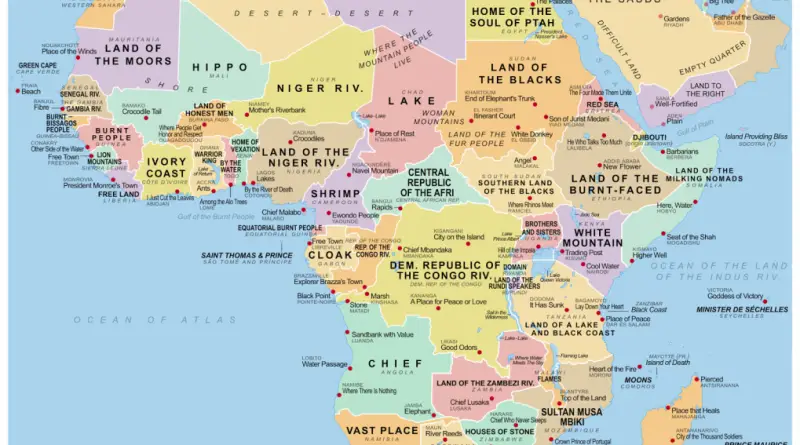
The name of the African continent itself was named after the Afri People, who lived in the area of Carthage (current-day Tunisia) during Roman times.
Read More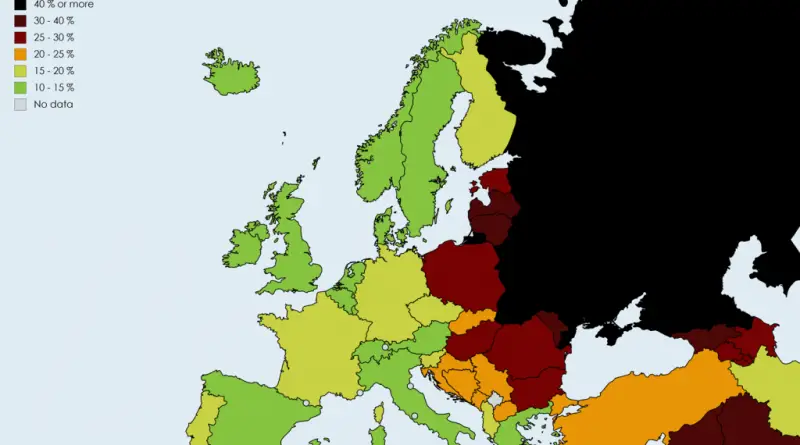
Reddit user: trinitronbx, Data worldbank.org European countries with the highest mortality rate among men under the age of 65: 1.
Read More
Biologically, a healthy woman could give birth to over 15 kids if she married early enough and did not try to evade pregnancy. Historically, human societies have never tried to raise fertility but have restricted it through access to marriage.
Read More