Real estate

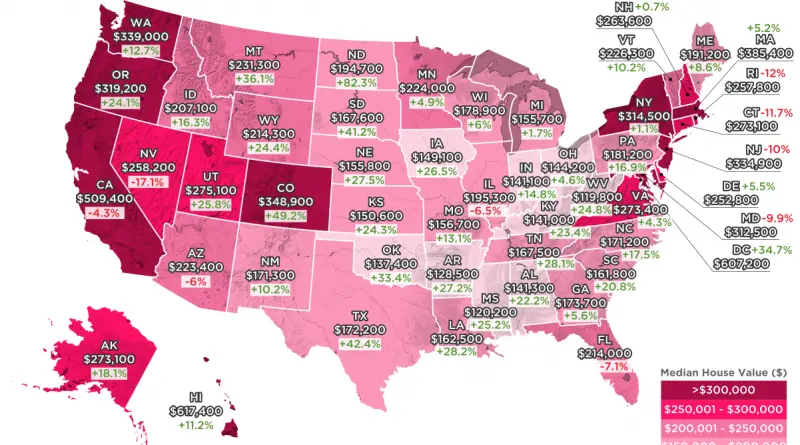
How Housing Prices Have Changed Ten Years After The Real Estate Bubble Burst

The median house prices now surpass 2007 levels in 41 states and Washington, DC. However, a closer look at the map reveals underwhelming growth, with 22 states seeing values increase by 20% or less over 10 years. Some areas experienced significant surges, such as North Dakota (+82.3%), Colorado (+49.2%), and Texas (+42.4%), driven by factors like shale fracking and population influx.

Read More
Ethnic maps

Average height of Asians

The average height of individuals across Asian countries exhibits a diverse range, shaped by a multitude of factors such as genetics, nutrition, healthcare, and socio-economic conditions. Generally, Asians are not uniformly distributed in terms of height, and there is considerable variation among different populations.

Read More
Animated mapsEthnic mapsNewsVivid maps

Leading group by U.S. county

The U.S. Census continues to recognize six racial categories: White American, Black or African American, American Indian and Alaska Native, Asian American, Native Hawaiian, and Other Pacific Islander. Additionally, the U.S. Census Bureau classifies Americans as “Hispanic” and “Not Hispanic,” identifying Hispanic Americans as an ethnicity distinct from others and constituting the largest minority group in the nation.

Read More