Top 50 US Metro Areas By GDP
The ten largest metro areas alone combine for a whopping 34 percent of the country’s total GDP.
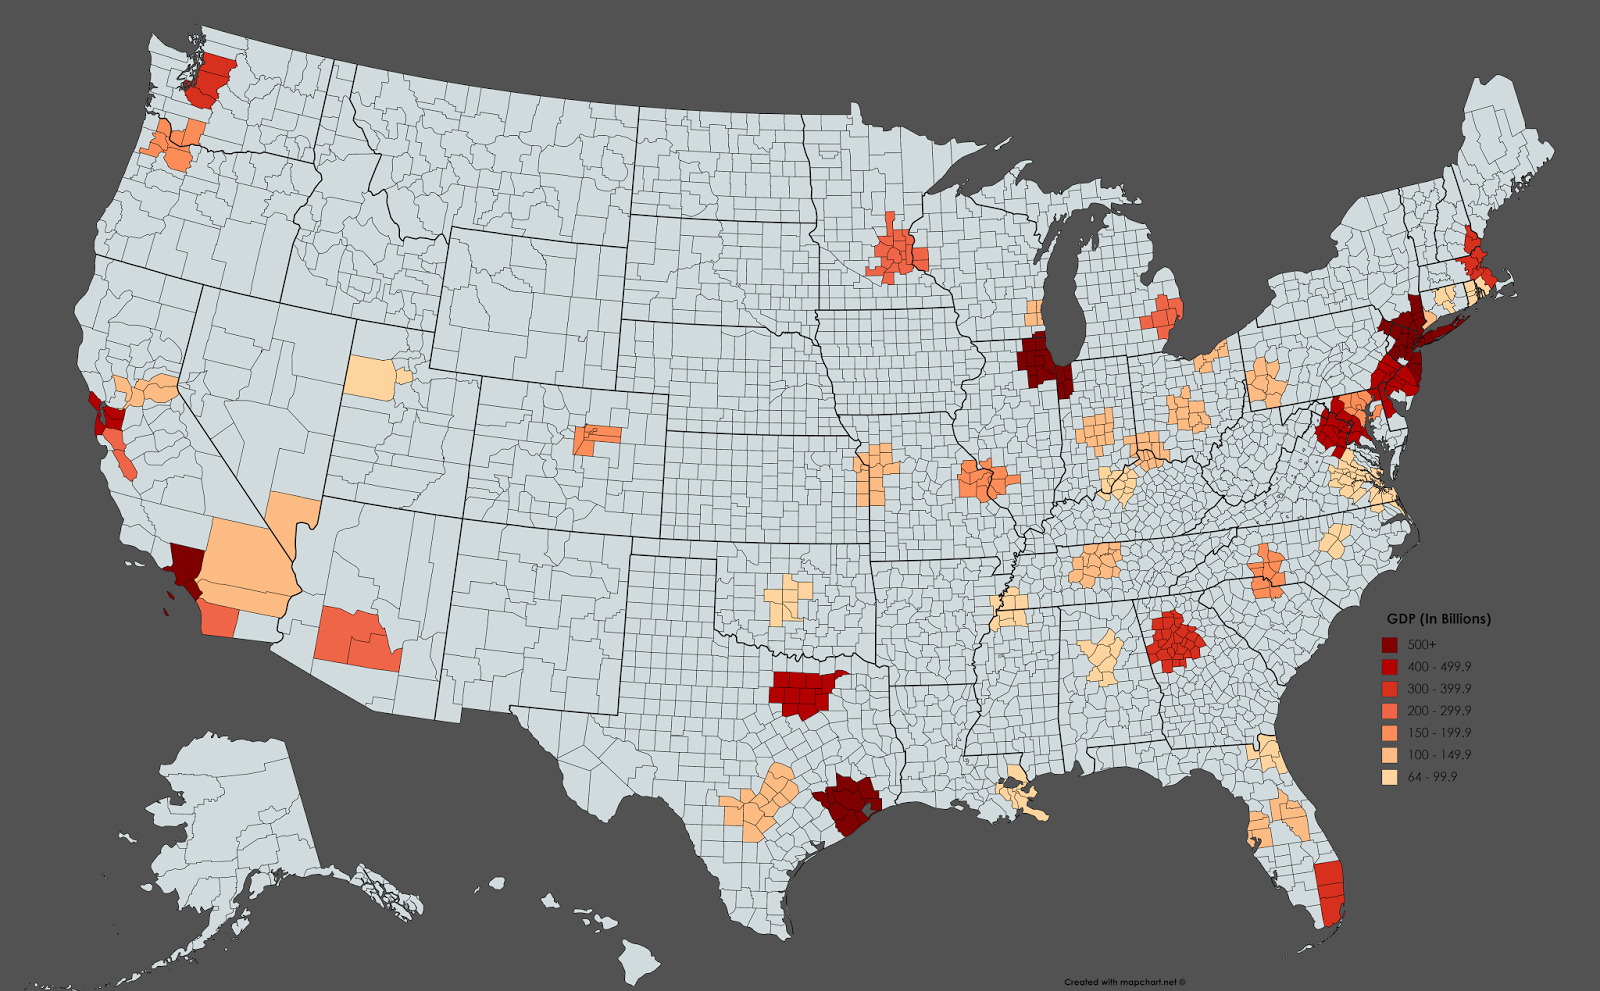
Nominal GDP for the top fifty U.S. metropolitan statistical areas (Millions of dollars)
| Metropolitan area | 2017 | 2016 | 2015 | 2014 | 2013 | 2012 |
|---|---|---|---|---|---|---|
| New York-Newark-Jersey City, NY-NJ-PA (Metropolitan Statistical Area) | 1,717,712 | 1,662,671 | 1,618,366 | 1,542,763 | 1,477,043 | 1,439,233 |
| Los Angeles-Long Beach-Anaheim, CA (Metropolitan Statistical Area) | 1,043,735 | 996.432 | 967.101 | 901.98 | 852.034 | 820.863 |
| Chicago-Naperville-Elgin, IL-IN-WI (Metropolitan Statistical Area) | 679.699 | 657.589 | 639.033 | 608.805 | 585.948 | 578.016 |
| Dallas-Fort Worth-Arlington, TX (Metropolitan Statistical Area) | 535.499 | 503.667 | 491.879 | 475.929 | 448.178 | 417.065 |
| Washington-Arlington-Alexandria, DC-VA-MD-WV (Metropolitan Statistical Area) | 529.99 | 509.599 | 491.779 | 471.254 | 459.268 | 454.224 |
| San Francisco-Oakland-Hayward, CA (Metropolitan Statistical Area) | 500.701 | 475.417 | 445.124 | 413.026 | 385.451 | 366.151 |
| Houston-The Woodlands-Sugar Land, TX (Metropolitan Statistical Area) | 490.074 | 472.331 | 494.837 | 507.183 | 488.43 | 462.299 |
| Philadelphia-Camden-Wilmington, PA-NJ-DE-MD (Metropolitan Statistical Area) | 444.975 | 431.384 | 418.605 | 400.621 | 389.787 | 370.052 |
| Boston-Cambridge-Newton, MA-NH (Metropolitan Statistical Area) | 438.684 | 419.783 | 407.675 | 380.769 | 364.804 | 355.585 |
| Atlanta-Sandy Springs-Roswell, GA (Metropolitan Statistical Area) | 385.542 | 369.806 | 347.604 | 326.502 | 307.75 | 291.481 |
| Seattle-Tacoma-Bellevue, WA (Metropolitan Statistical Area) | 356.572 | 334.411 | 317.153 | 296.028 | 280.291 | 267.472 |
| Miami-Fort Lauderdale-West Palm Beach, FL (Metropolitan Statistical Area) | 344.882 | 330.784 | 315.624 | 292.308 | 268.198 | 266.563 |
| San Jose-Sunnyvale-Santa Clara, CA (Metropolitan Statistical Area) | 275.293 | 253.9 | 237.832 | 210.69 | 193.716 | 180.996 |
| Detroit-Warren-Dearborn, MI (Metropolitan Statistical Area) | 260.612 | 250.43 | 242.296 | 229.348 | 220.277 | 215.614 |
| Minneapolis-St. Paul-Bloomington, MN-WI (Metropolitan Statistical Area) | 260.106 | 250.376 | 242.053 | 232.416 | 220.938 | 213.855 |
| Phoenix-Mesa-Scottsdale, AZ (Metropolitan Statistical Area) | 242.951 | 231.011 | 221.57 | 209.596 | 199.871 | 195.63 |
| San Diego-Carlsbad, CA (Metropolitan Statistical Area) | 231.845 | 222.963 | 211.807 | 204.915 | 198.312 | 189.074 |
| Denver-Aurora-Lakewood, CO (Metropolitan Statistical Area) | 208.868 | 197.068 | 192.499 | 186.345 | 173.016 | 167.491 |
| Baltimore-Columbia-Towson, MD (Metropolitan Statistical Area) | 192.178 | 186.856 | 178.895 | 173.073 | 167.27 | 162.776 |
| Charlotte-Concord-Gastonia, NC-SC (Metropolitan Statistical Area) | 174.029 | 165.367 | 155.592 | 143.367 | 136.399 | 131.934 |
| Portland-Vancouver-Hillsboro, OR-WA (Metropolitan Statistical Area) | 171.772 | 164.503 | 156.869 | 148.029 | 143.13 | 144.551 |
| St. Louis, MO-IL (Metropolitan Statistical Area) | 161.281 | 157.716 | 155.377 | 150.667 | 146.336 | 142.184 |
| Riverside-San Bernardino-Ontario, CA (Metropolitan Statistical Area) | 157.931 | 150.576 | 144.079 | 133.909 | 127.771 | 120.47 |
| Austin-Round Rock, TX (Metropolitan Statistical Area) | 148.75 | 135.936 | 127.804 | 119.572 | 111.72 | 103.513 |
| Pittsburgh, PA (Metropolitan Statistical Area) | 147.367 | 137.944 | 136.684 | 133.691 | 126.824 | 122.439 |
| Tampa-St. Petersburg-Clearwater, FL (Metropolitan Statistical Area) | 146.349 | 141.569 | 135.569 | 127.963 | 125.706 | 117.711 |
| Indianapolis-Carmel-Anderson, IN (Metropolitan Statistical Area) | 143.873 | 137.94 | 130.825 | 127.667 | 123.565 | 116.257 |
| Cleveland-Elyria, OH (Metropolitan Statistical Area) | 138.98 | 131.727 | 128.887 | 123.856 | 118.335 | 114.671 |
| Cincinnati, OH-KY-IN (Metropolitan Statistical Area) | 138.034 | 132.588 | 127.587 | 123.356 | 120.413 | 115.42 |
| Columbus, OH (Metropolitan Statistical Area) | 136.296 | 131.382 | 126.021 | 118.391 | 113.236 | 109.268 |
| Nashville-Davidson—Murfreesboro—Franklin, TN (Metropolitan Statistical Area) | 133.251 | 126.148 | 118.024 | 107.932 | 101.188 | 96.274 |
| Orlando-Kissimmee-Sanford, FL (Metropolitan Statistical Area) | 132.448 | 128 | 123.054 | 115.309 | 115.249 | 103.535 |
| Kansas City, MO-KS (Metropolitan Statistical Area) | 131.092 | 127.485 | 125.765 | 120.758 | 115.711 | 112.028 |
| San Antonio-New Braunfels, TX (Metropolitan Statistical Area) | 129.298 | 119.544 | 115.02 | 110.313 | 101.348 | 93.33 |
| Sacramento—Roseville—Arden-Arcade, CA (Metropolitan Statistical Area) | 126.352 | 121.202 | 116.189 | 109.223 | 104.463 | 100.242 |
| Las Vegas-Henderson-Paradise, NV (Metropolitan Statistical Area) | 112.288 | 107.452 | 103.734 | 93.742 | 90.426 | 87.098 |
| Milwaukee-Waukesha-West Allis, WI (Metropolitan Statistical Area) | 105.427 | 102.76 | 99.343 | 100.051 | 96.994 | 93.915 |
| Bridgeport-Stamford-Norwalk, CT (Metropolitan Statistical Area) | 98.256 | 99.282 | 96.896 | 95.656 | 92.545 | 90.441 |
| Virginia Beach-Norfolk-Newport News, VA-NC (Metropolitan Statistical Area) | 94.855 | 92.321 | 91.725 | 87.088 | 85.414 | 84.485 |
| Hartford-West Hartford-East Hartford, CT (Metropolitan Statistical Area) | 90.318 | 87.908 | 88.387 | 83.416 | 82.699 | 82.791 |
| Salt Lake City, UT (Metropolitan Statistical Area) | 87.801 | 84.11 | 80.644 | 75.214 | 71.636 | 70.114 |
| Raleigh, NC (Metropolitan Statistical Area) | 83.288 | 79.946 | 75.777 | 69.056 | 64.534 | 62.615 |
| Providence-Warwick, RI-MA (Metropolitan Statistical Area) | 82.929 | 80.257 | 78.52 | 74.614 | 72.338 | 71.042 |
| Richmond, VA (Metropolitan Statistical Area) | 82.739 | 79.508 | 76.875 | 72.157 | 69.831 | 67.572 |
| New Orleans-Metairie, LA (Metropolitan Statistical Area) | 79.29 | 76.617 | 78.82 | 76.309 | 72.811 | 77.413 |
| Jacksonville, FL (Metropolitan Statistical Area) | 76.65 | 72.727 | 68.81 | 64.001 | 62.166 | 58.519 |
| Louisville/Jefferson County, KY-IN (Metropolitan Statistical Area) | 76.063 | 73.908 | 71.699 | 68.316 | 62.91 | 61.813 |
| Oklahoma City, OK (Metropolitan Statistical Area) | 74.884 | 70.828 | 72.253 | 69.406 | 67.693 | 63.356 |
| Memphis, TN-MS-AR (Metropolitan Statistical Area) | 72.503 | 71.088 | 69.318 | 66.91 | 65.875 | 65.186 |
| Urban Honolulu, HI (Metropolitan Statistical Area) | 67.495 | 64.977 | 62.943 | 58.955 | 57.315 | 55.267 |

