Countries Producing Most Carbon Dioxide Mapped
This post may contain affiliate links. As an Amazon Associate, we earn from qualifying purchases.
Carbon dioxide covers 74 percent of greenhouse gas emissions. Most CO2 emissions (89 percent) are from the usage of fossil fuels. Carbon dioxide can also be released from direct human-caused influences on land use, such as deforestation, using land for agriculture, and soil degradation.
Global yearly greenhouse gas emissions have grown 40 percent since 1990 and still growing. Energy consumption is the most significant source of human-induced greenhouse gas emissions, responsible for a vast 72 percent globally.
Table of Contents
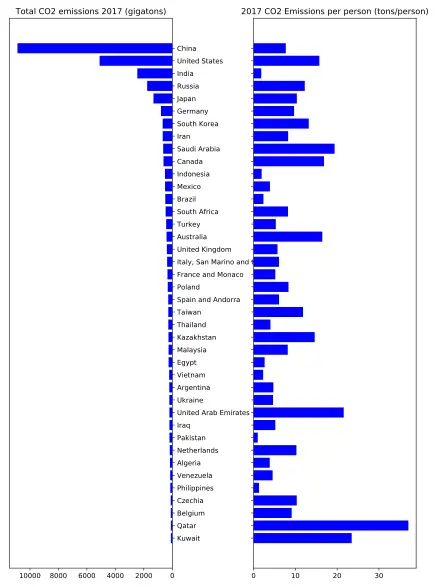
Countries by carbon dioxide emissions
Ten developed nations contribute more than 68 percent of global greenhouse gas emissions. According to the World Bank, China is the biggest emitter at 26 percent of global greenhouse gas emissions, accompanied by the U.S. at 13 percent, the EU at 8 percent, and India at 7 percent.
The map below shows nations by carbon dioxide emissions.

Top 10 countries by CO2 emissions
| Rank | Country | CO2 Emissions, millions of tons |
|---|---|---|
| 1 | China | 10,433 |
| 2 | United States | 5,012 |
| 3 | India | 2,534 |
| 4 | Russia | 1,662 |
| 5 | Japan | 1,240 |
| 6 | Germany | 775,752 |
| 7 | Canada | 675,919 |
| 8 | Iran | 642,560 |
| 9 | South Korea | 604,044 |
| 10 | Indonesia | 530,036 |
But the countries of the world are very different in terms of population, and this, too, must be taken into account when assessing countries’ contribution to global carbon dioxide emissions.
Which countries produce a bigger proportion of carbon dioxide emissions than their proportion of the world population?
Common discussions of emissions decreases in countries with smaller populations sometimes suggest that smaller countries contribute very little to global emissions compared to giants like China or India. But it is essential to understand that some of these small nations pollute much more disproportionately than the big polluters. For example, Canada’s population equals 0.49% of the total world population. Canada’s CO2 emissions currently represent about 1.6 % of the global total.
The map below created by Reddit user UnrequitedReason, using World Bank & EU Join Research Centre data, displays which nations contribute more CO2 than they contribute to the global population.

The map makes it easy to understand that some countries take more than their fair share from the planet.
Now it is time to assess the effectiveness of the world’s economies in terms of carbon dioxide emissions.
Which countries contribute a greater proportion of carbon dioxide emissions than they contribute to global GDP
The map below displays which nations pollute the most disproportionately for their level of consumption and production.

<1x nations have especially effective industries and the best regulatory standards. While the >1x nations are below-par.
For instance, Ulaanbaatar (Mongolia) is the coldest capital city in the world, and many of the pastoral nomads live in yurts. So to stay warm, they burn large quantities of coal because they don’t have any other option.
The next map show which countries produce a greater proportion of global carbon dioxide emission than their contribution to the global GDP in PPP.

<1x nations are more likely to have service-oriented economies and produce fewer emissions for their level of production, while the >1x countries are more likely to be industrial-based. But the service-oriented economy often, importing the emission-related stuff from abroad (for example from China), thus “not contributing” or just being poor without many industries.


