For generations, atlases showed humanity as a set of types with borders between them. A London school sheet from 1851 colored the world in five “races”. A German plate from 1892 dropped the race names and mapped skin and hair. Even in 1962 Carleton Coon’s book The Origin of Races still argued for five, now called Caucasoid, Mongoloid, Congoid, Capoid and Australoid. Many more maps like these filled the atlases of the 19th and early 20th centuries, and nearly all of them leaned on outward features such as skin color, hair and skull shape.
Scientists now consider discrete race maps obsolete. The maps that replaced them follow DNA, and they show lineages and gradients instead of borders.
For generations, and as late as 1962, maps sorted humanity into a few “races” using skin, hair and skulls. DNA data replaced that picture with maps of genetic similarity, ancestral lineages and a diversity that declines with distance from East Africa. Scientific societies now describe race as a social category and not a biological division.
Key Takeaways
Genetic diversity declines with distance from East Africa.
For generations, and as late as 1962, maps divided humanity into groups using visible features such as skin, hair and skulls.
A 2002 study found that 93 to 95% of human genetic variation lies within populations.
Modern maps trace similarity, descent and diversity, and draw no borders between types.
How did maps divide humanity before DNA?
John Emslie engraved the 1851 sheet and James Reynolds published it in London on December 13 of that year. It was a school diagram with an inset map of religions and a strip of skull outlines. Its five colored zones came from Johann Friedrich Blumenbach, who fixed the names Caucasian, Mongolian, Ethiopian, American and Malay in 1795.
The sheet’s own table counts 852 million people and splits them among the five groups.
Group on the 1851 map
Population (millions)
Share of 852 million (%)
Caucasian
330
38.7
Mongolian
360
42.3
Ethiopian
96
11.3
Malay
28
3.3
American
38
4.5
World
852
100.0
Researchers next tried to be more precise about what the eye could see. Georg Gerland’s 1892 plate in the Berghaus atlas, published in Gotha by Justus Perthes, pairs a skin color map with a hair map. The race names are gone. Skin gets six categories and hair is split into spiral and straight. Gerland still needed diagonal hatching for shades that occur between his zones.
The old labels lingered. J. G. Bartholomew’s statistical atlas of 1907 carries a plate titled Races of Mankind, and Coon’s 1962 book came with 13 maps and argued that five races had existed for at least half a million years. DNA data were about to take that framework apart.
What do maps of human diversity show today?
DNA changed what gets mapped. Instead of borders between types, the new maps show similarity, descent and diversity.
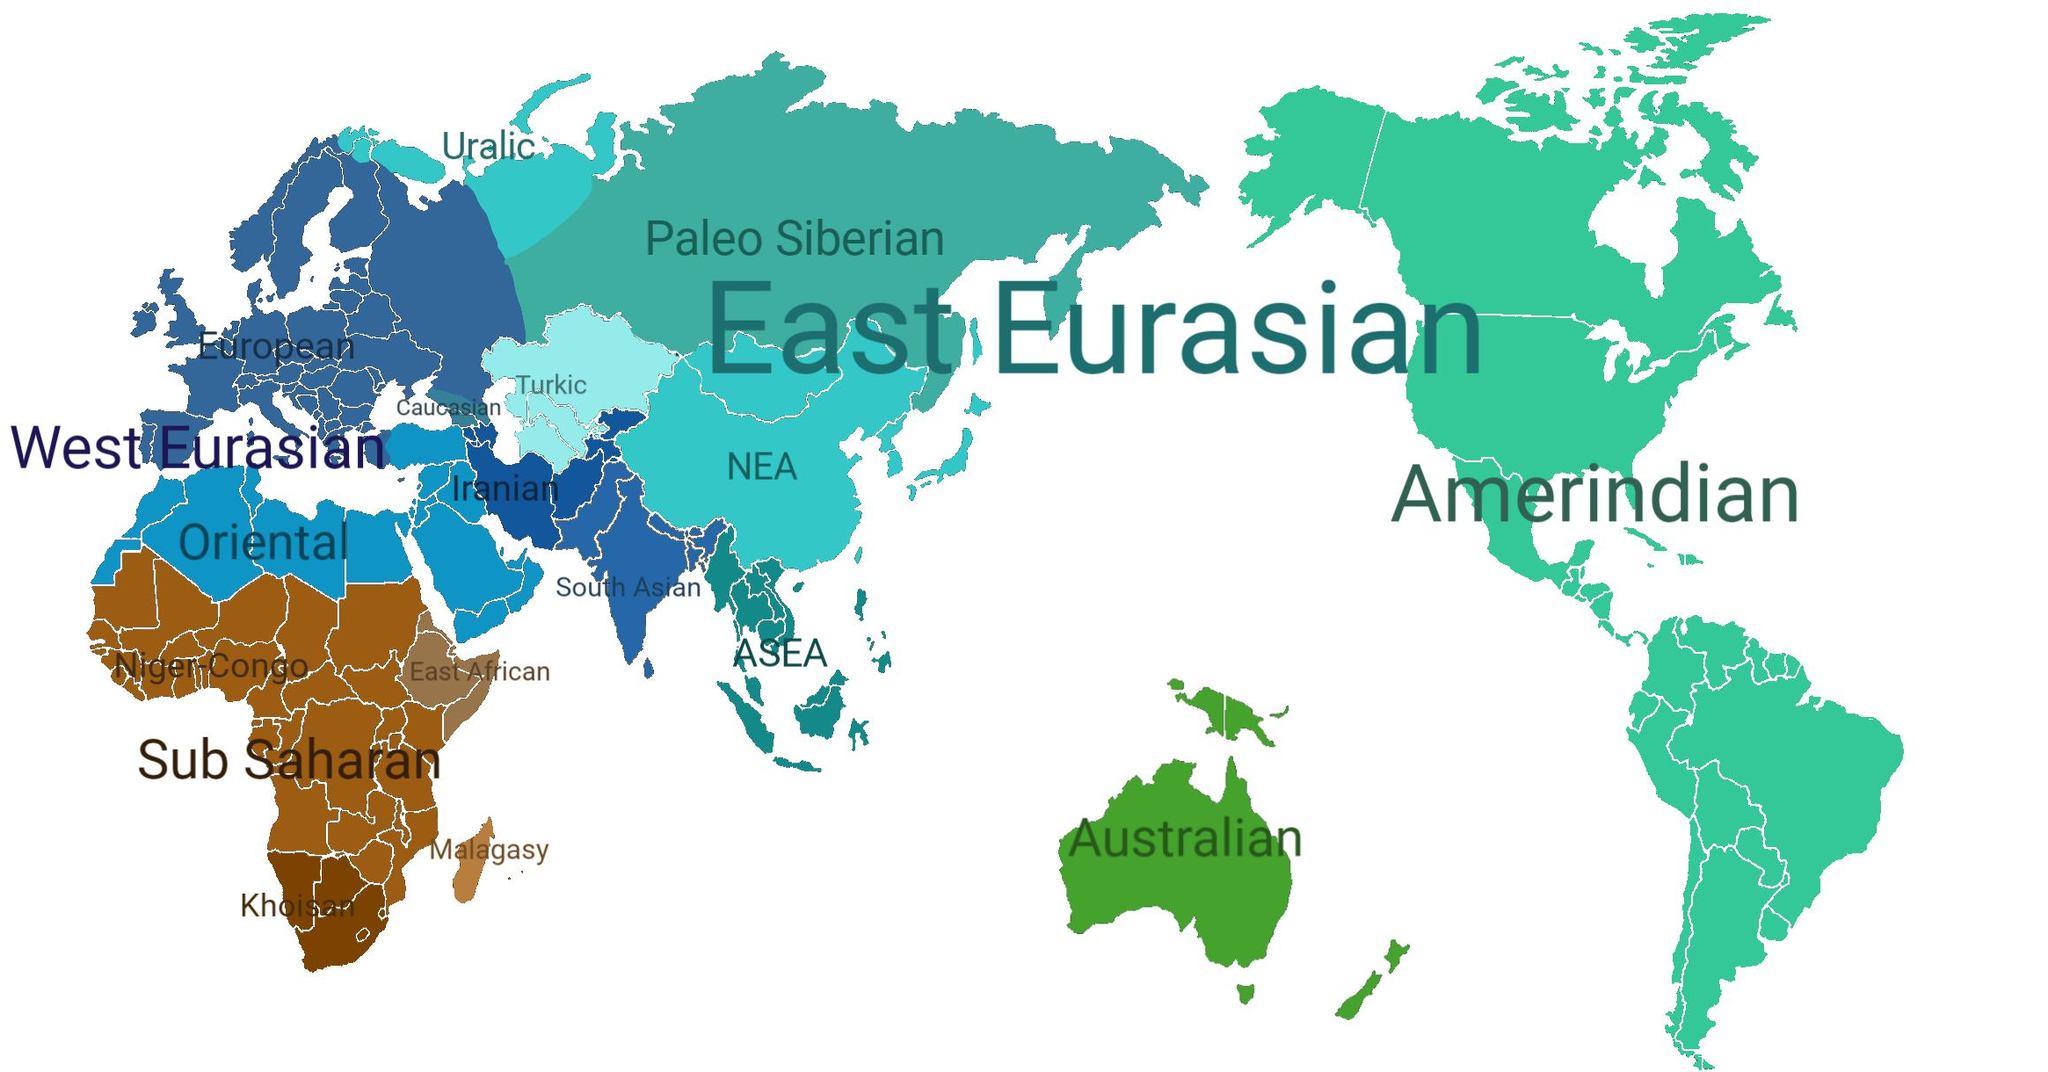
Ancestry maps group people by genetic similarity. In 1994 Cavalli-Sforza, Menozzi and Piazza charted gene frequencies for over 110 traits in more than 1,800 populations. A 2002 study in Science analyzed 1,056 people from 52 populations and found six main clusters, five of them matching major regions, with 93 to 95% of variation inside populations. In 2008 researchers plotted 1,387 Europeans by their DNA, and the plot looked like a map of Europe. People from neighboring regions were genetically close, and half of them could be placed within 310 km (193 mi) of their reported origin. The borders on that genetic map were fuzzier than on the political one.
A global overview of major genetic ancestry clusters, from broad regional groupings such as West Eurasian, East Eurasian, Sub-Saharan African, Amerindian, and Australian to more specific populations, including Uralic, Turkic, Iranian, Caucasian, South Asian, Northeast Asian, Mainland Southeast Asian, and Paleo-Siberian groups. References: Cavalli-Sforza, Menozzi & Piazza, The History and Geography of Human Genes (1994); David Reich, Who We Are and How We Got Here (2018); Hellenthal et al., “A Genetic Atlas of Human Admixture History,” Science (2014).
Haplogroup maps follow single lines of descent, the Y chromosome from father to son and mitochondrial DNA from mother to child. National Geographic launched the Genographic Project in 2005 to trace migrations out of Africa from more than 100,000 samples. Later sequencing dated the most recent common ancestor of all Y chromosomes to 120 to 156 thousand years ago, and that of mitochondrial DNA to 99 to 148 thousand years ago.
The Y-DNA Haplogroups with possible migration routes.
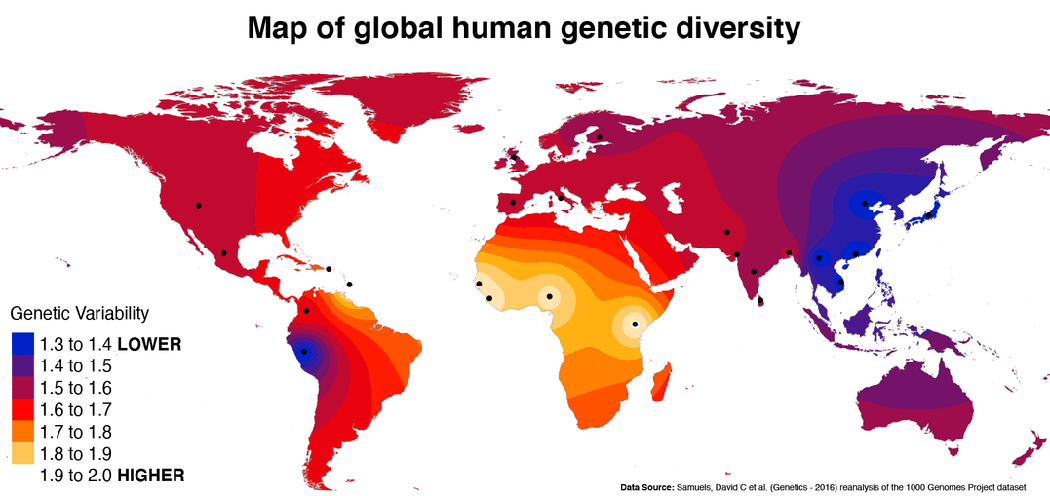
Diversity maps show where variation itself is highest. A 2005 PNAS study found that diversity across the world is best explained by an expansion that began in Africa. Heterozygosity declines with distance from East Africa, because each new colony carried only part of its parent group’s variation.
Map of global human genetic diversity created by Reddit user heresacorrection, using data from Samuels et al. (Genetics, 2016), a reanalysis of the 1000 Genomes Project dataset.
How do scientists and governments describe race now?
Human geneticists call race a social construct. Anthropologists go further and say it was never an accurate picture of human variation, past or present, though it remains a social category with real consequences. Official forms move slower. The 2024 US federal standard describes its categories as socio-political constructs and adds a Middle Eastern or North African category.