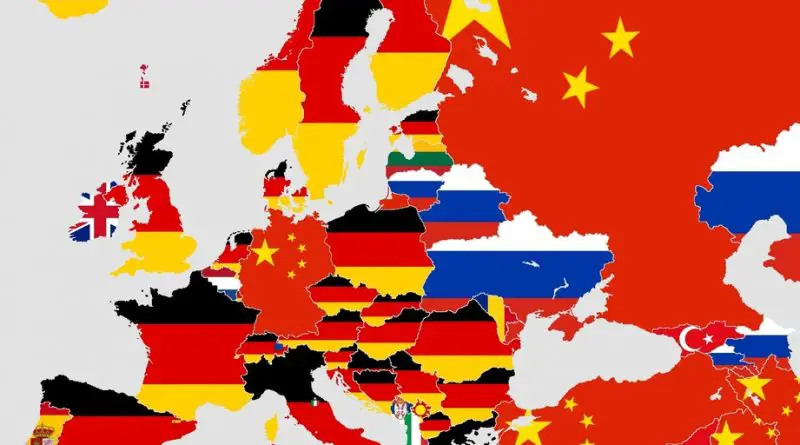
Europe’s Trade Map: How Its Biggest Partners Changed Between 2018 and 2023
Discover how Europe’s trade relationships have transformed from 2018 to 2023, influenced by geopolitical events and economic shifts.
Read MoreMaps to explain economic geography.
Discover how Europe’s trade relationships have transformed from 2018 to 2023, influenced by geopolitical events and economic shifts.
Read More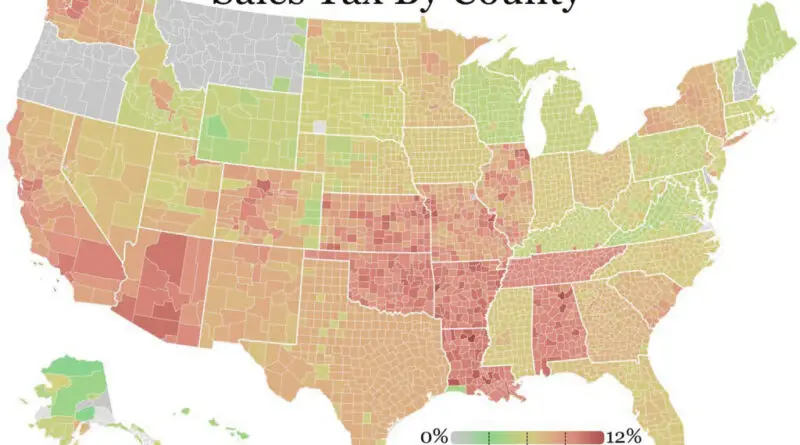
Discover how U.S. sales tax rates have changed from 2022 to 2025, with insights into state and local adjustments and their broader impacts.
Read More
The American housing market has changed significantly, altering the traditional rent-versus-buy equation. While homeownership was once considered the best financial move, rising costs have flipped the script in many places. Explore what’s behind this shift and see how your city compares.
Read More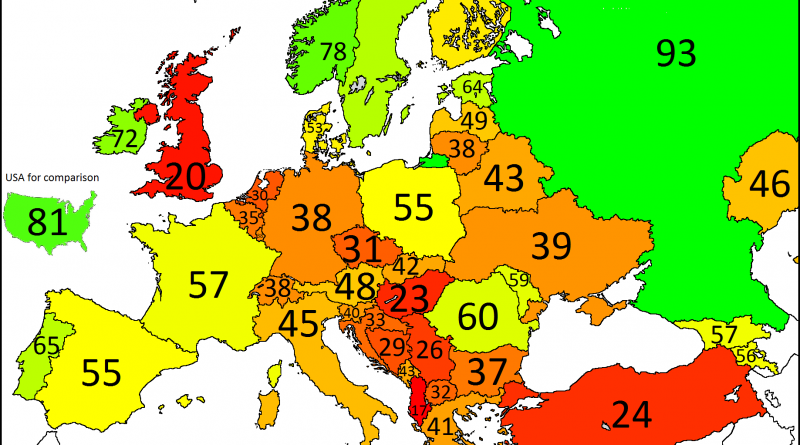
How does your purchasing power for transportation vary depending on where you live? This analysis reveals striking disparities across Europe, where a day’s salary in Russia lets you travel 93 kilometers (58 miles) by taxi, while in the UK it covers just 20 kilometers (12.4 miles). Even more dramatic are the differences in fuel purchasing power: a Swiss monthly salary buys 3,240 liters (856 gallons) of gasoline, while Moldova’s average wage gets just 233 liters (62 gallons). Through three detailed maps, we explore these transportation inequalities and their implications for daily mobility across different regions. The data reveals fascinating patterns of North-South divides and the lasting economic impact of historical boundaries, while recent changes in global fuel prices continue to reshape the transportation landscape.
Read More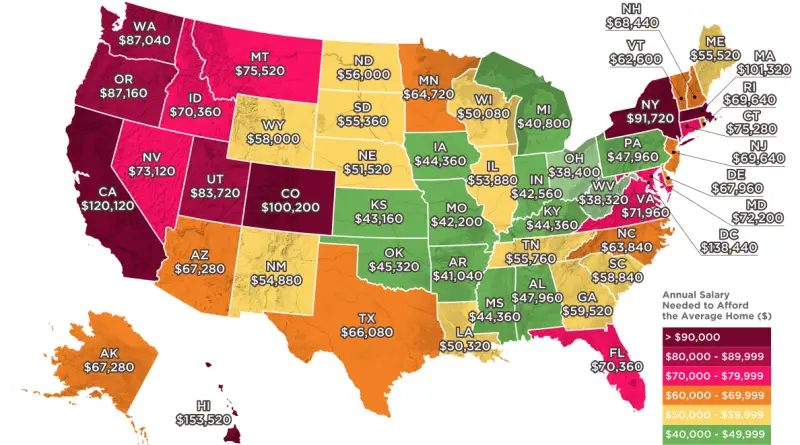
Home prices are soaring, but how much do you really need to afford a house in your state? See the salary requirements based on 2018 data and how affordability has shifted over time.
Read More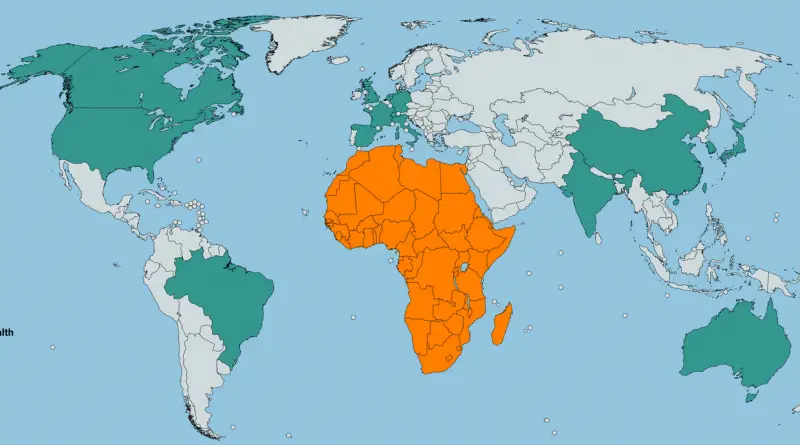
Africa’s economic underdevelopment is attributed to a combination of historical, social, political, and economic factors.
Read More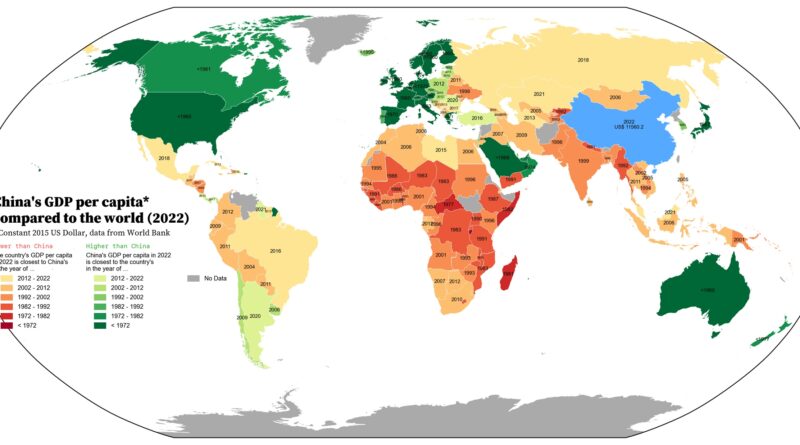
China’s economy has expanded at an incredible pace, surpassing major world economies. But where does it stand in terms of GDP per capita? These maps put things into perspective.
Read More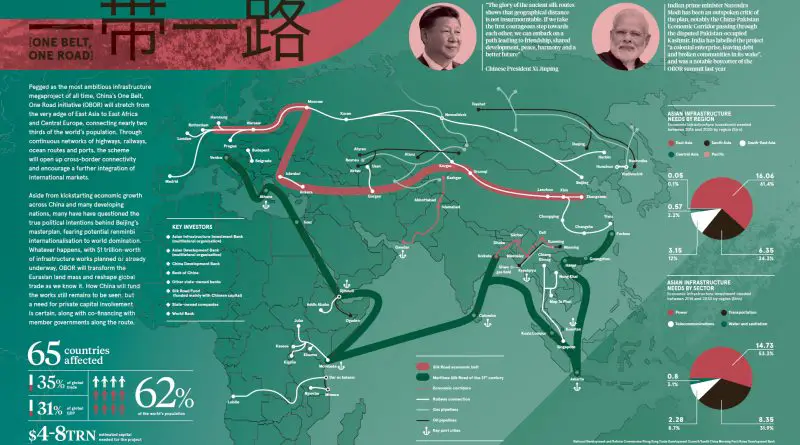
Discover how China’s One Belt, One Road Initiative aims to reshape global trade routes, foster international connectivity, and potentially redefine economic power dynamics worldwide.
Read More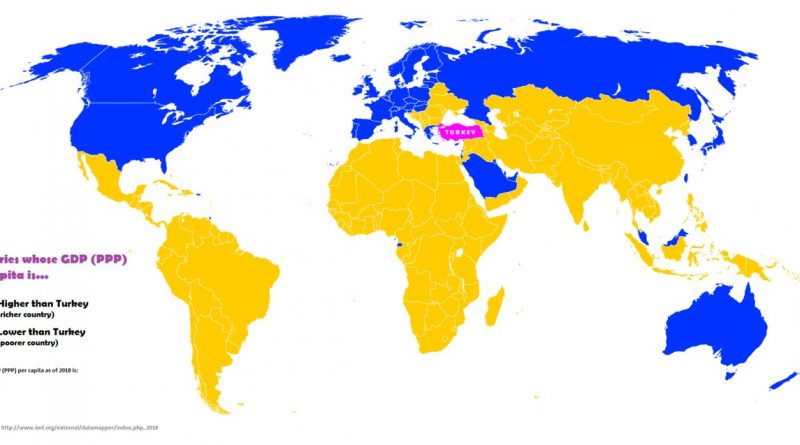
Turkey’s GDP (PPP) per capita was $27,630 in 2018. See how Turkey compares to the rest of the world and its neighboring countries in terms of economic strength.
Read More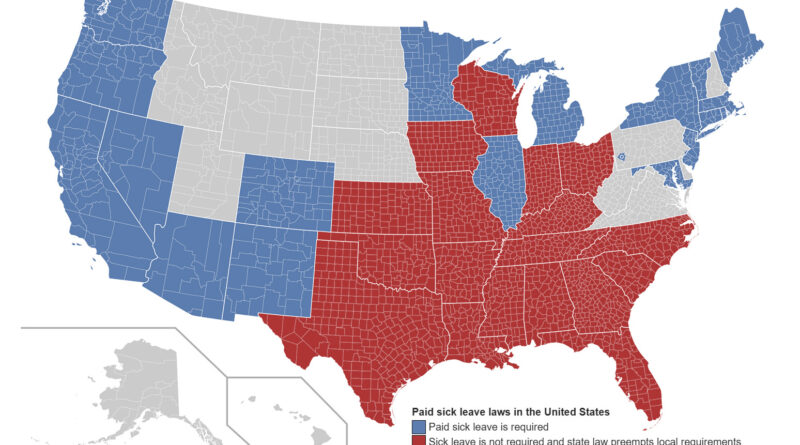
Paid sick leave laws vary widely across the United States. This map highlights which states require it, where it’s preempted, and how these policies affect workers.
Read More