List of U.S. states & Canadian provinces by Human Development Index
Created with mapchart.net
Read MoreMaps to explain economic geography.
Created with mapchart.net
Read More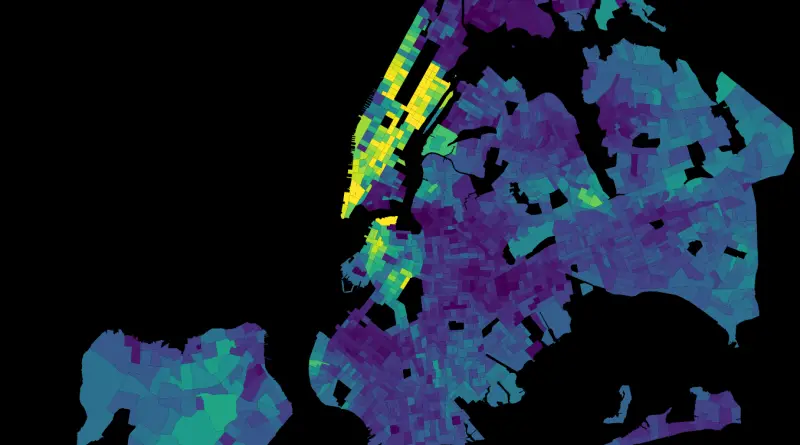
Related posts: – Mapping New York’s economy – New York city’s schools are even more divided than housing – Inequality
Read MoreIn 2016, new passenger car registrations showed a consistent increase (+6.8%), totalling 14,641,356 units and marking the third consecutive year
Read More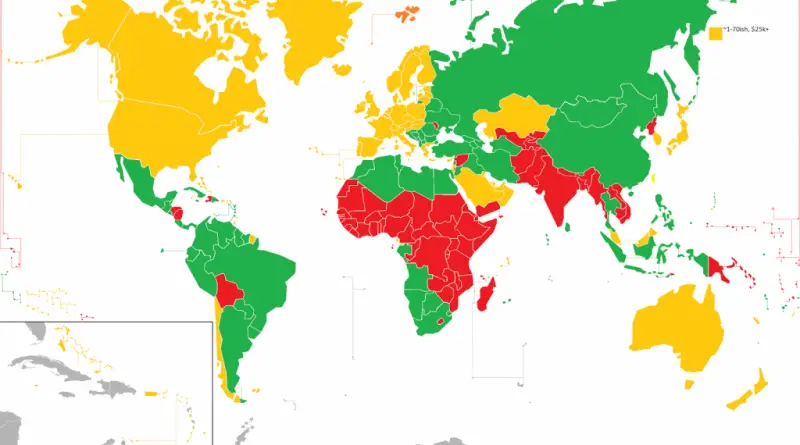
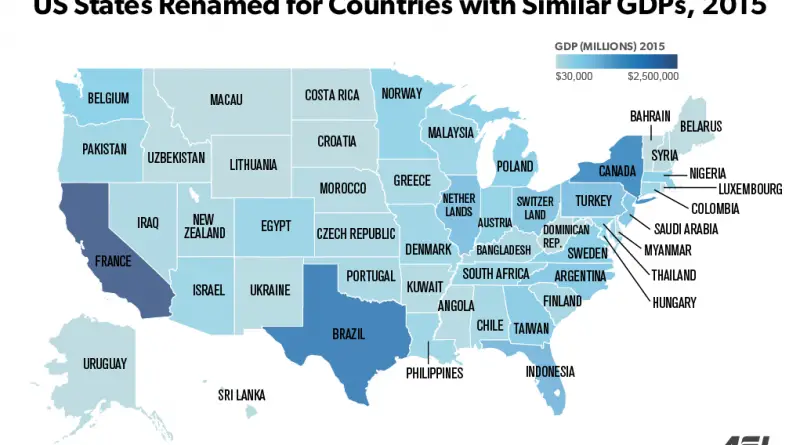
The new 1st, 2nd, and 3rd World according to Gross Domestic Product (GDP) per capita The new 1st, 2nd, and
Read MoreAll figures are in current Geary-Khamis dollars, more commonly known as international dollars (INT$). Data source: International Monetary Fund (www.imf.org)
Read MoreThe Distressed Communities Index are based on a geography’s combined performance on the seven well-being metrics (No High School Degree,
Read MoreIn 1989, 11 percent of large metropolitan counties suffered from high levels of inequality, In 2014 – 21 percent. The
Read MoreVia businessinsider.com Related post: – Most popular bank in each State
Read More