
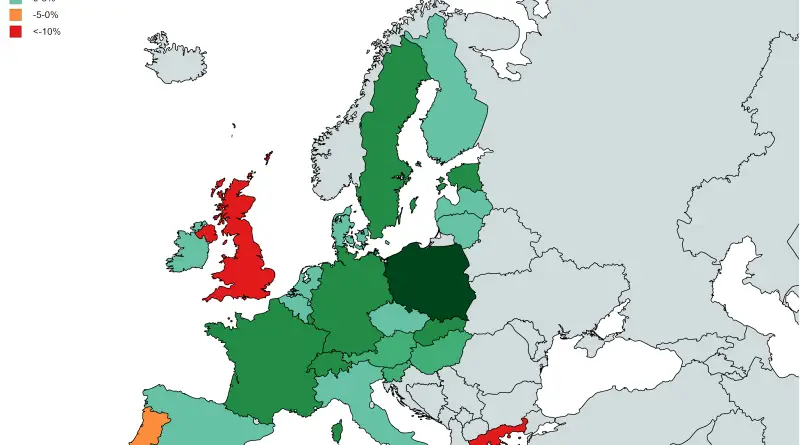
Economic maps
Maps to explain economic geography.
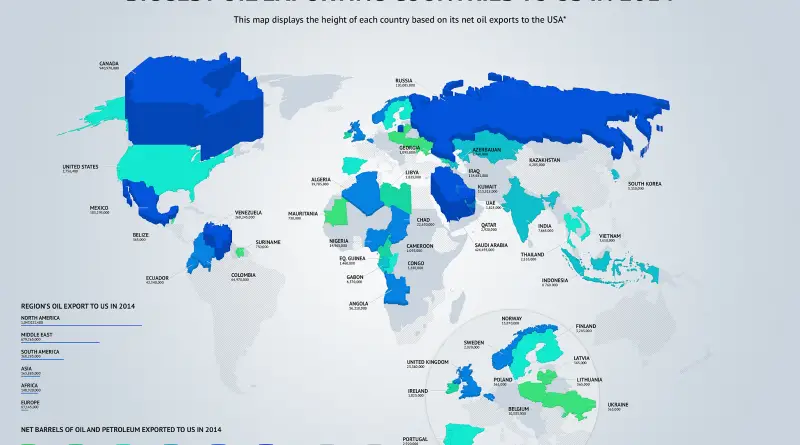
Biggest oil exporting countries to U.S. (2014)
This map displays the height of each country based on its net oil exports to the USA.
Read more: Biggest oil exporting countries to U.S. (2014)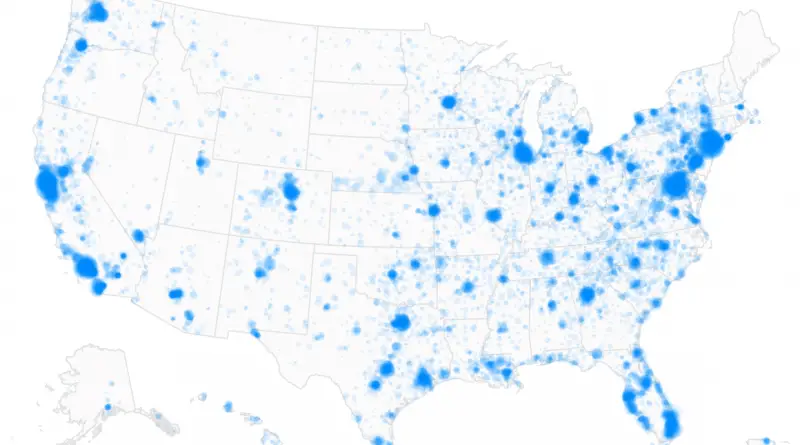
Tracking the 2016 Presidential Money Race
Where the money came from? Hillary Clinton (Campaign raised to date – $264.4M) Donald Trump (Campaign raised to date –
Read more: Tracking the 2016 Presidential Money RaceThe relative value of $100: Which state offers the biggest bang for your buck?
The real value of $100 in each U.S. state. Numbers represent value of goods that $100 dollars can buy in
Read more: The relative value of $100: Which state offers the biggest bang for your buck?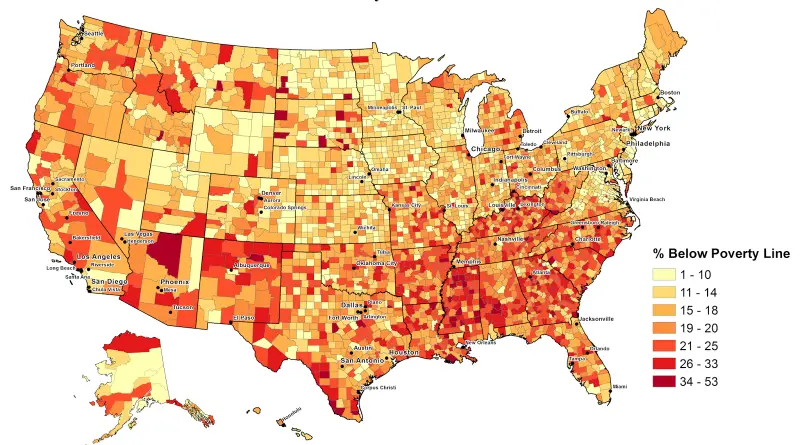
Poverty in the United States
% of people below the poverty line for each U.S. county. Top 10 poorest counties1. Shannon County (South Dakota) –
Read more: Poverty in the United StatesOveral fiscal solvency: How do the 50 states rank?
Ranking the U.S. states by fiscal condition. This ranking of the 50 states is based on their fiscal solvency in
Read more: Overal fiscal solvency: How do the 50 states rank?
US States renamed after countries with similar GDPs (2015)
Related posts: – US’ individual GDPs compared to countries around the world (2015) – This map shows US states labeled
Read more: US States renamed after countries with similar GDPs (2015)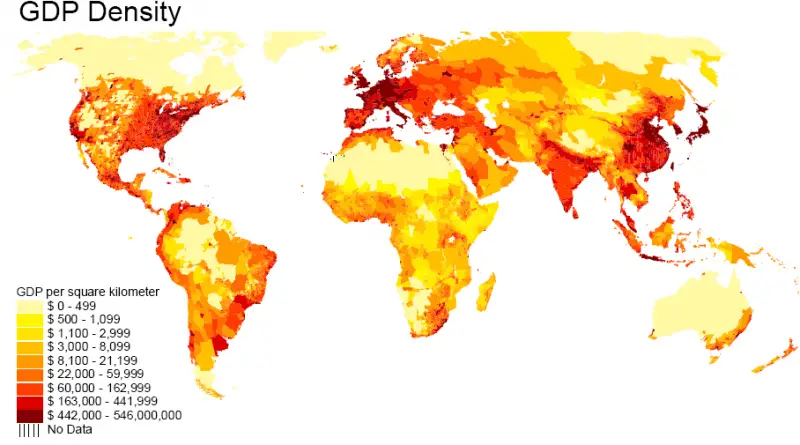
Distribution of World GDP Mapped
According to the World Bank is $93,864 trillion (2021). The U.S. is the World’s largest economy, with a GDP of about $22,675 trillion. China is the second-largest economy in the World ($16,642 trillion). Tuvalu is the World’s smallest economy, with a GDP of approximately $45 million.
Read more: Distribution of World GDP Mapped