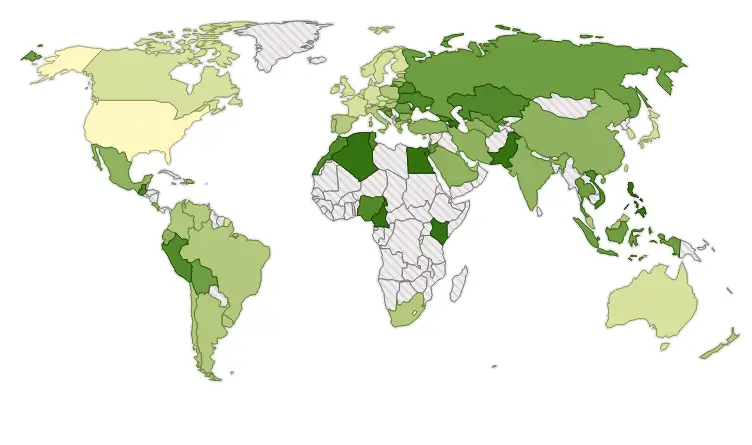
Food spending around the world
Advanced nations spend much less proportionately on food but the share of spending has been decreasing across wealthy and poor
Read MoreMaps to explain economic geography.
Advanced nations spend much less proportionately on food but the share of spending has been decreasing across wealthy and poor
Read MoreIncome inequality has been rising in many rich countries in recent decades. In the 1980s, the most prosperous 10 percent of the population in OECD countries earned seven times more than the poorest 10 percent. They now earn nearly ten times more.
Read MoreFrom 1860 to 1870, the South of the U.S. demonstrated considerable homogeneity in land value gains across specific regions, such as urban areas and river counties. On average, the most significant increases occurred in the slave-dense areas such as the Mississippi Delta and Cotton Belt.
Read MoreThe Human Development Index is a statistic composite index of life expectancy, education, and per capita income indicators, which are
Read MoreThe map below based on Organisation Internationale des Constructeurs d’Automobiles data. Vehicles produced per one thousand inhabitants by county: Slovakia
Read MoreThe map below shows imports of goods and services details by country. Imports of Goods and Services
Read MoreThe purchasing power standard is an artificial currency unit. Theoretically, one Purchasing Power Standard can buy the same amount of
Read MoreTurkey, Ireland, the UK, Iran, and Russia are the world’s biggest tea drinkers. Turkey is the largest tea-consuming country in
Read MoreU.S. states by GDP (% of Nation) California – 14.17 Texas – 8.64 New York – 8.10 Florida – 5.00
Read MoreIn only 12 U.S. counties can a full-time worker earning the prevailing federal or state minimum-wage afford a one-bedroom rental
Read More