What the world’s nations are best at, revealed in one map
Every country is the best or the worst at something. So what your specific country best or worst at in the entire world?
Read MoreMaps to explain economic geography.

Every country is the best or the worst at something. So what your specific country best or worst at in the entire world?
Read More
A tax refund is the amount of money returned to taxpayers by the government when they have paid more taxes than they owe. The size of a tax refund varies depending on various factors, including income, deductions, credits, and individual circumstances.
Read More
Loudoun (Va) is the richest county in the United States in terms of median income. It is more than $100,000 higher than Buchanan County, VA, the state’s poorest county at $31,800.
Read More
The concept of takeout food has been present in various forms throughout history. In the United States, the origins of modern takeout can be traced back to the late 19th and early 20th centuries. Immigrant communities often brought their culinary traditions with them, and many established small food businesses that offered prepared meals for purchase.
Read More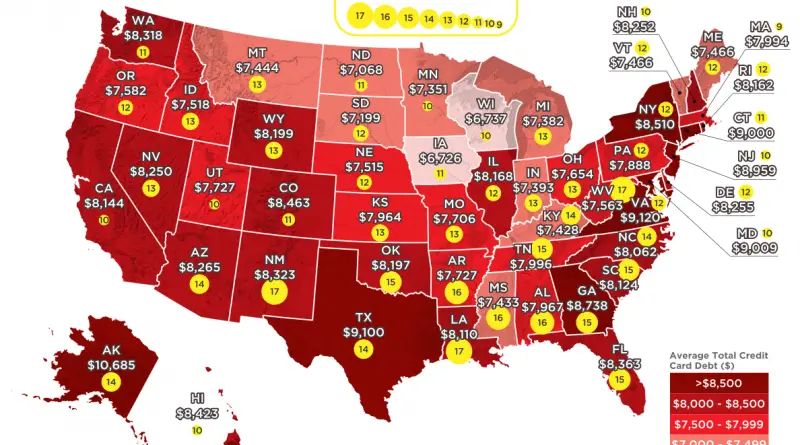
Many individuals set New Year’s resolutions with the intention of improving their personal financial circumstances. Among the top priorities is
Read More
the leading beneficiaries of foreign direct investment as of the conclusion of 2021 comprised the following nations: the United States, the Netherlands, Luxembourg, China, the United Kingdom, Hong Kong SAR, Singapore, Ireland, Switzerland, and Germany.
Read More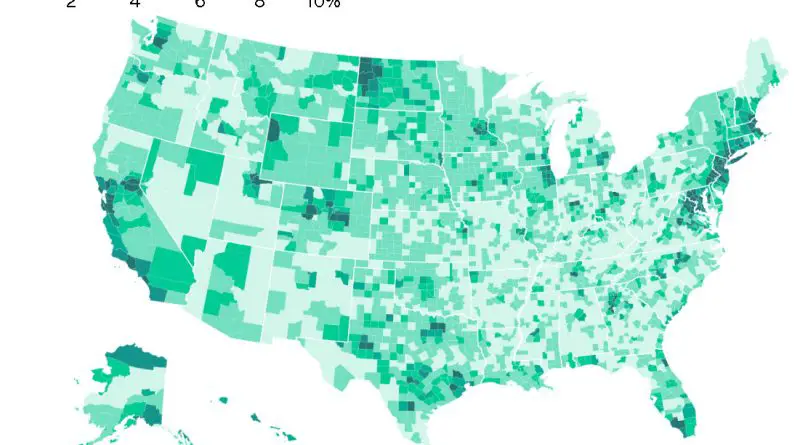
Household income in the United States is a critical economic indicator that measures the combined earnings of all individuals living in a single household.
Read More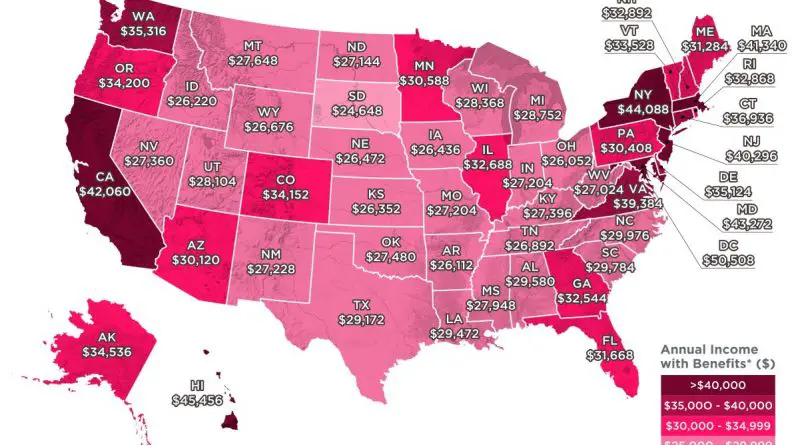
Economic security is the condition of having a stable income to support a standard of living now and in the foreseeable future.
Read More
In the realm of fostering new businesses, various jurisdictions exhibit varying degrees of support. From fundamental tasks like establishing electricity connections and registering businesses to navigating more intricate regulatory challenges, the location you choose can significantly influence the success of your venture. What characteristics render a country business-friendly, and which places offer a smoother path to establishing your enterprise?
Read More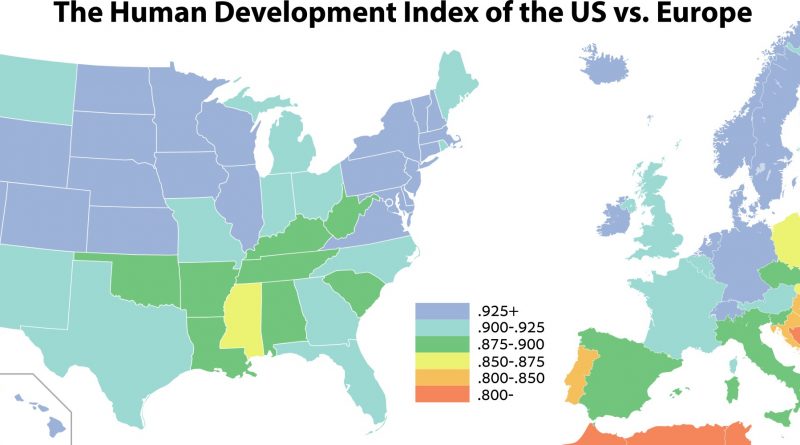
While both the United States and Europe are highly developed regions with relatively high HDI scores, there are notable differences in areas such as healthcare, education, income inequality, and social welfare that contribute to variations in their respective human development profiles.
Read More