Germany’s Raccoon Invasion: How an American Bandit Took Over Europe
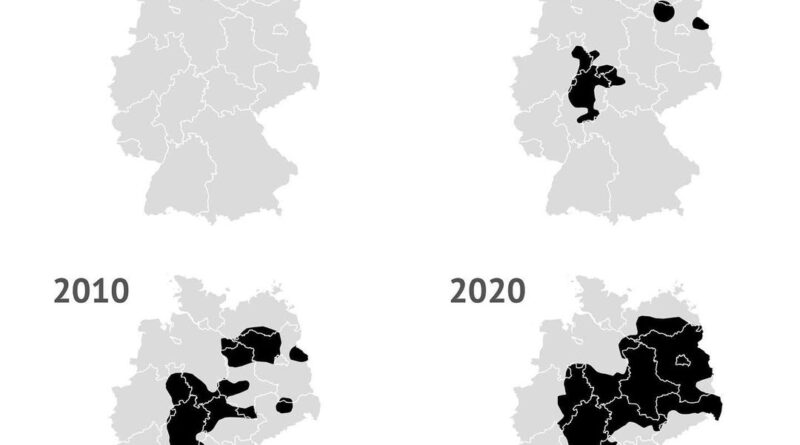
Once a North American native, the raccoon has become an unstoppable force in Germany, thriving in cities and forests alike. From their accidental introduction in the 1930s to their modern-day population explosion, discover how raccoons have taken over Germany—and the challenges they pose.
Read More