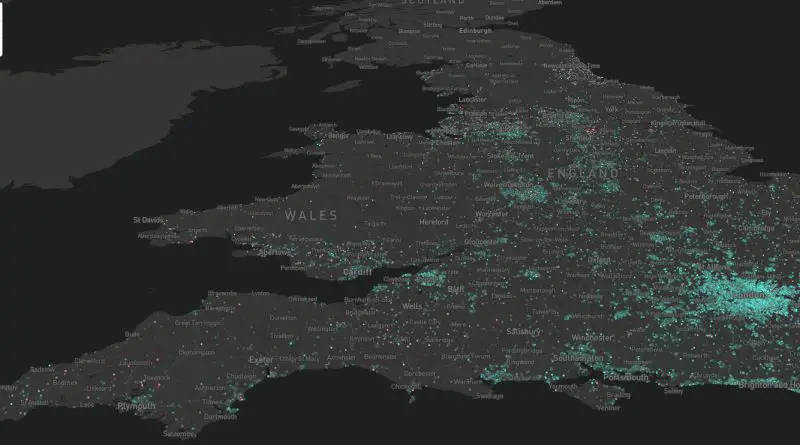
Where in the UK House Prices are Rising and Falling
Our latest blog post dives into the fascinating world of UK property prices, featuring an interactive map that reveals a decade of change. From London’s ever-rising values to surprising declines in some coastal towns, we explore the economic and social factors shaping the UK’s housing landscape.
Read More