20 Best Maps of 2019
Now that 2019 is almost done, we think it would be interesting to look backward at our most favored maps of the year.
Read MoreNow that 2019 is almost done, we think it would be interesting to look backward at our most favored maps of the year.
Read MoreBlack Americans compose the 2nd-largest racial group in the United States, after White Americans and Hispanic Americans. African Americans make up 14.6% (47.8 million) of the U.S. population. In recent decades, there has been an increase in U.S. counties with a predominance of blacks.
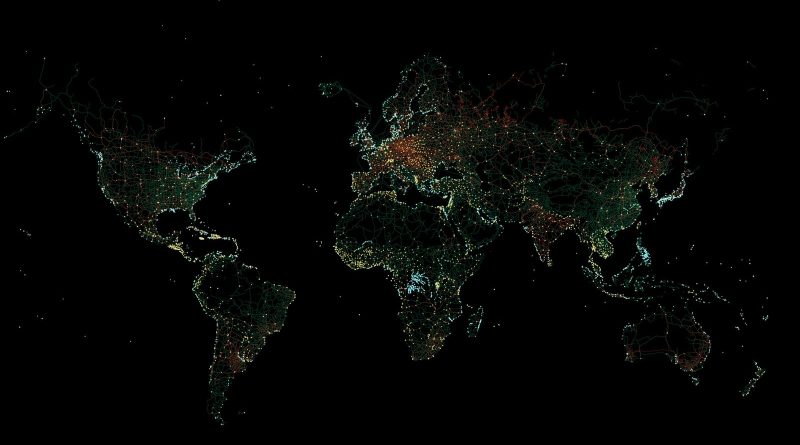
Read MoreThe maps are based on distance from cities, roads, railways, and airports. The green areas represent places where travel to the city, road and other transportation facilities can be measured in hundreds of kilometers.
Read MoreThe road system of the U.S. surpasses four million miles in combined length, plus numerous public line roads (8.3 million miles), other service roads, and off-road driving trails.
Read MoreMany of the world’s cities will face sharply different climates by 2050. I tried to visualize how climate change will affect 6,000 world cities. London could feel as hot as Paris by 2050, with Paris’s climate more like San Francisco. San Francisco feels like Melbourne and New York City like Bologna (Italy). The climate of Moscow will be similar to that of Boston.
Read More3 percent (4.5 million km2 / 2.8 million mi2) of the Earth’s land cover is occupied by urban areas. However, even non-urban areas contain roads, railroads, and other marks of human presence. Only ten percent of the world is indeed a wilderness.
Read MoreToday, the number of children aged 0-4 in the U.S. is 19.7 million. Between 2008 and 2020, the population aged 0-4 years in the United States was declining on average by 0.51 percent every year, although, before that, it rose from 16.6 million persons in 1979 to 21.1 million persons in 2008.
Read MoreThe U.S. population is distributed unevenly. The Census evaluates that in the U.S. population living across over 3,000 counties. A mere 140, or 4.5%, of U.S. counties, are home to approximately 50% of those people.
Read MoreThe population of kids aged 14 and under is about 61.4 million in 2020, representing 18.5 percent of the United States population. Population aged 0-14 years of the U.S. fell steadily from 26.9% in 1972 to 18.5% in 2020.
Read More64.8% of the United States population is of working age (15-64 years). In percentage terms, America’s working-age population achieved its highest rate in 2006 and 2007, when 67.3% of the American population was of working age. Over the last decade, the increase of the non-working-age population — ages 0 to 14 and 65 and older — has exceeded the growth of the working-age population.
Read More