News

AgricultureNewsVivid maps

Tea Consumption by Country and How It Changed Since 2010

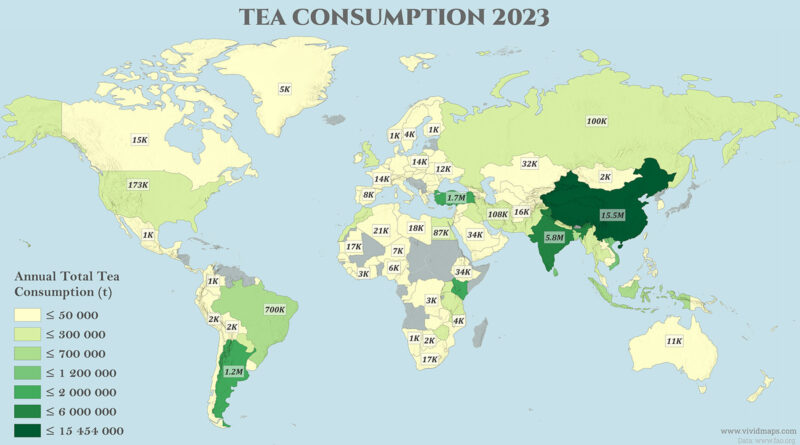
Global tea and mate supply grew from 11,476 to 33,091 thousand tonnes between 2010 and 2023. China and India together account for about 64 percent of the 2023 total. Sri Lanka leads every country in per capita consumption at 51.69 kg (114.0 lbs) per person. Vietnam and Turkiye posted the sharpest per capita gains of the period.

Read more: Tea Consumption by Country and How It Changed Since 2010
ClimateClimate ChangeNewsVivid maps

Canada’s Shifting Climate Zones: Köppen-Geiger Maps from 1930 to 2099

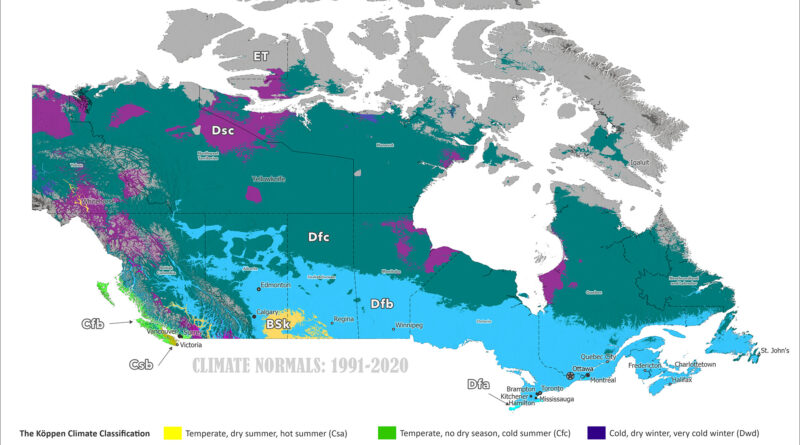
Köppen-Geiger climate maps of Canada reveal dramatic northward shifts from 1901-1930 to 2077-2099. Animated comparisons show tundra retreating to Arctic islands, subarctic zones moving hundreds of kilometers north, tree line advancing, and southern continental climates warming under the ssp2-4.5 scenario.

Read more: Canada’s Shifting Climate Zones: Köppen-Geiger Maps from 1930 to 2099
AgricultureNewsVivid maps

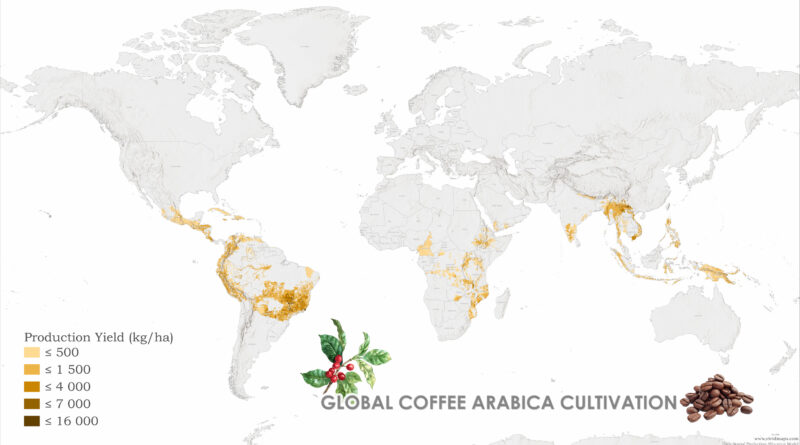
From Highland Peaks to Lowland Valleys: Mapping the World’s Coffee and Tea Territories

Ever wondered why your morning coffee tastes different from your afternoon tea? The answer lies in altitude, climate, and centuries of agricultural adaptation. Join me on a cartographic journey through the landscapes that bring these beloved beverages to your cup.

Read more: From Highland Peaks to Lowland Valleys: Mapping the World’s Coffee and Tea Territories