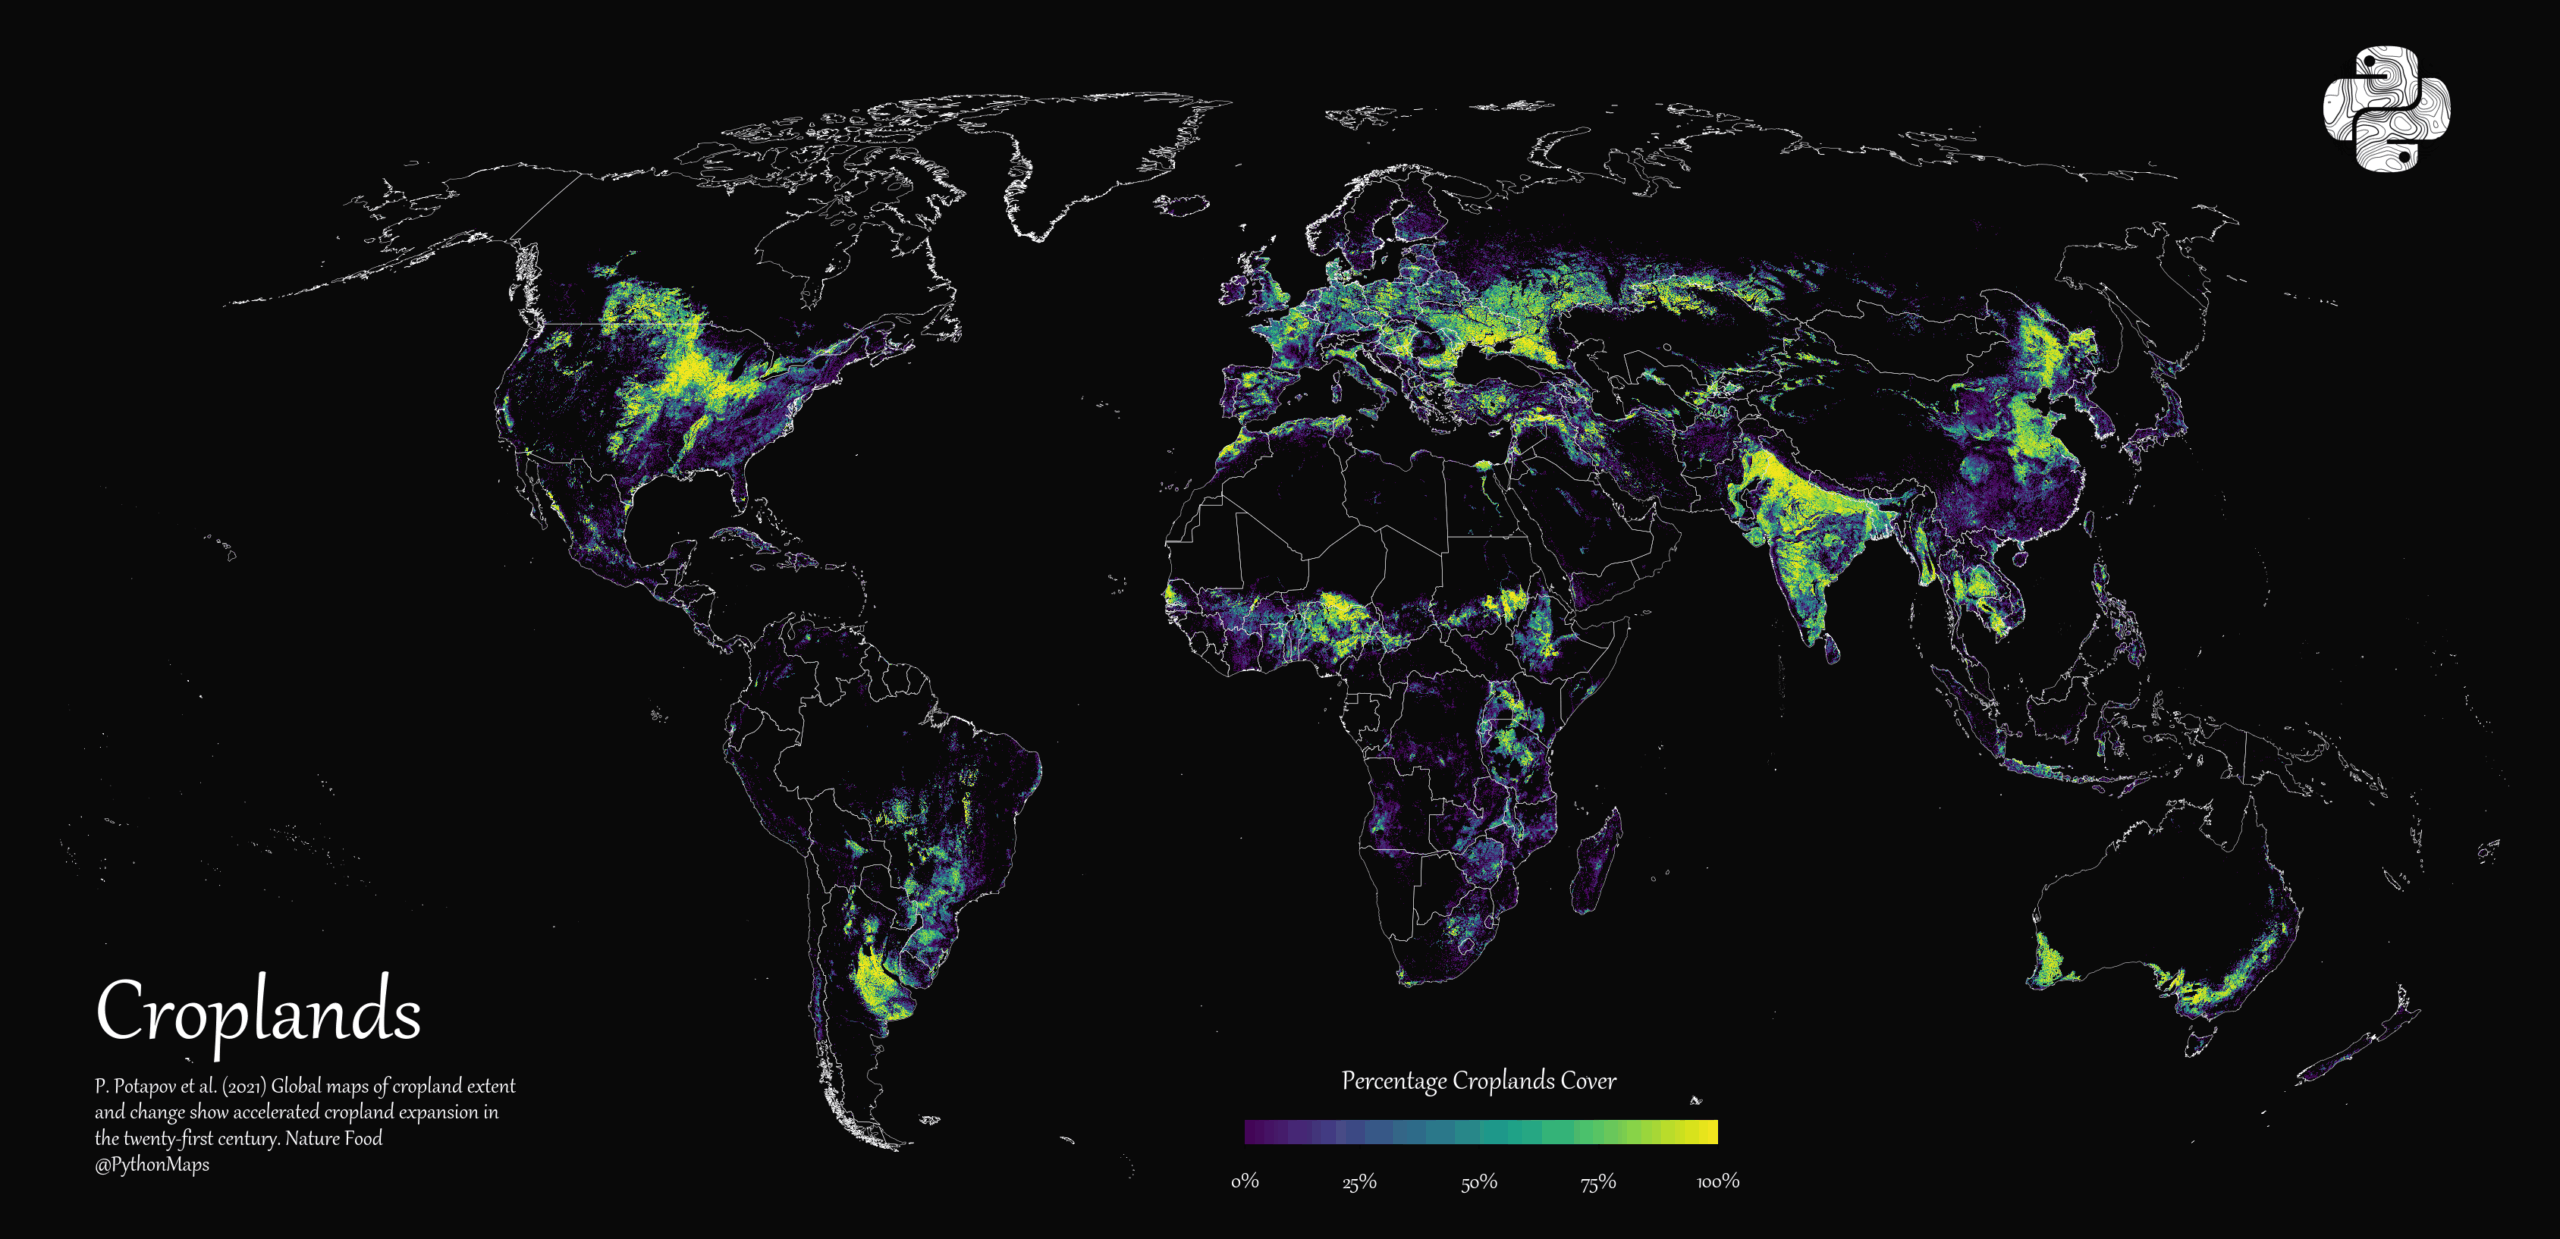
There are 8 billion mouths to feed on Earth right now. So where’s all the farmland coming from?
The world map below was created by Adam Symington based on satellite imagery results from Peter Potapov’s research team, which tracks global cropland distribution.
Areas of cropland continue to grow. Between 2000 and 2019, we converted 101.9 million hectares to agriculture.
Region
Cropland 2000-03 (Million Hectares)
Cropland 2016-19 (Million Hectares)
Change
Africa
155.1
208.3
+53.2
South America
75.5
112.6
+37.1
Southwest Asia
237.3
244.8
+7.5
Australia and New Zealand
37.3
40.3
+3.0
North and Central America
192.1
193.9
+1.8
Europe and North Asia
252.3
253.2
+0.9
Southeast Asia
192.7
191.1
-1.6
World
1,142.3
1,244.2
+101.9
Africa gained 53.2 million hectares. South America added 37.1 million. Just these two continents represent 90.3 million of the 101.9 million hectare global increase.
Europe? Less than a million hectares. North America added 1.8 million. The wealthy countries barely expanded their agricultural footprint while the tropics transformed dramatically.
So what happened to create 90 million hectares of new cropland in Africa and South America? Forests disappeared. Grasslands got converted.
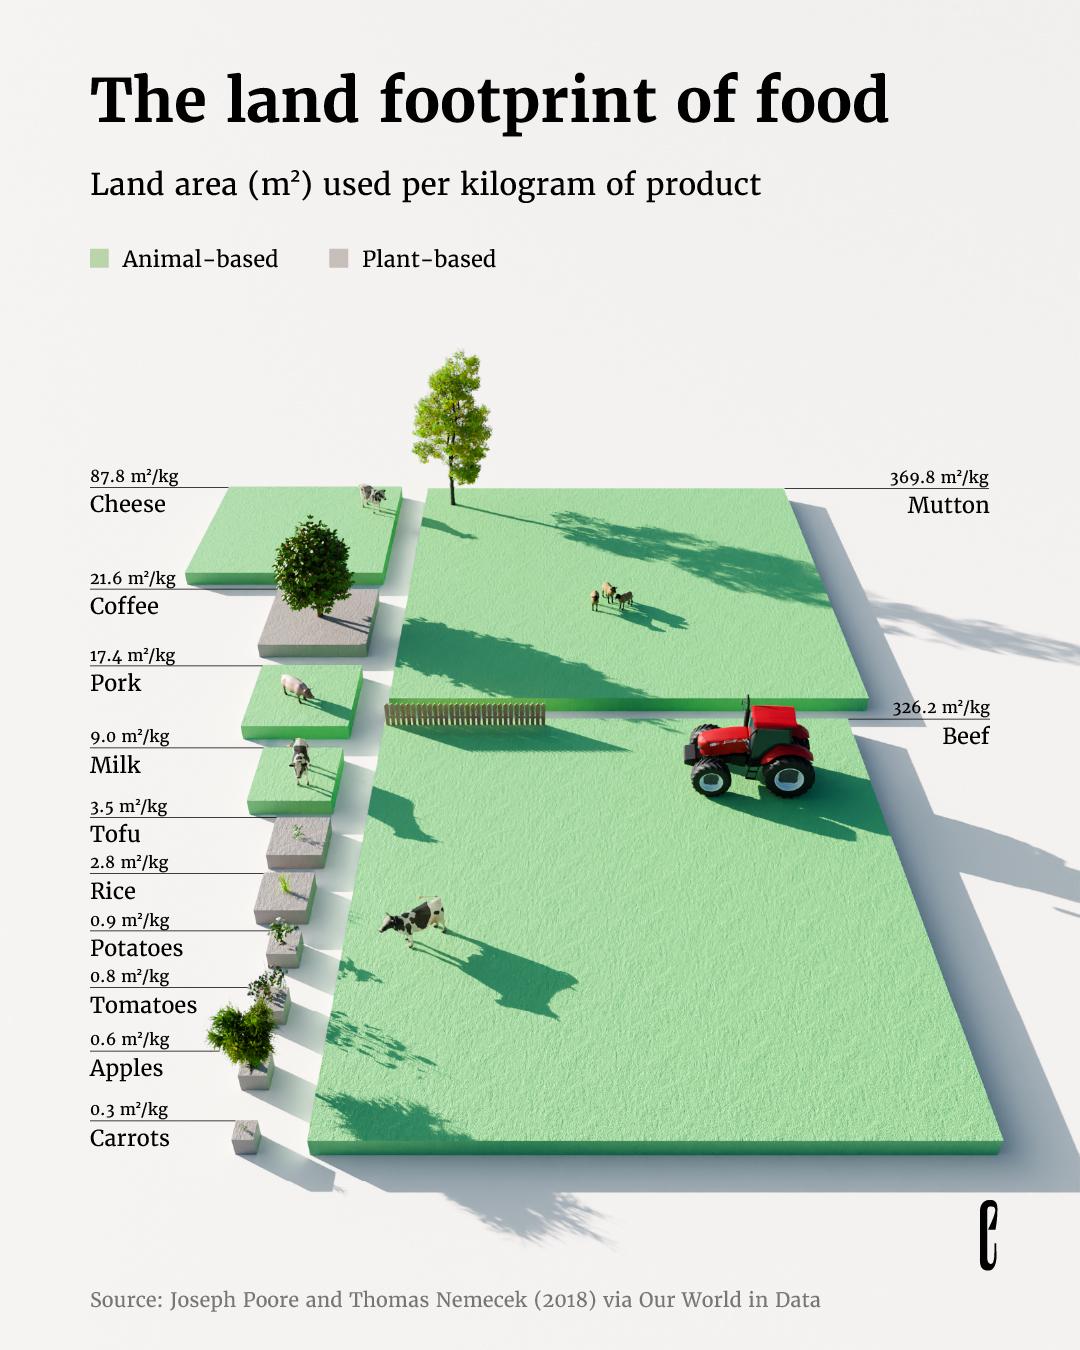
How Much Land Different Foods Actually Need
When it comes to feeding the world’s population, our current approach to agriculture is not very efficient. We could do better by growing crops that need less land, which would help protect forests and other ecosystems. This makes our choice of crops very important. This is clearly illustrated by the visualization created by Reddit user t0on, who utilized data from Joseph Poore and Thomas Nemecek (2018) to calculate the amount of land required to produce one kilogram of various foods.
For instance, this data shows beef needs 326 square meters per kilogram annually, while apples need just 0.63 square meters!
Food Product
Land Use (m²/year per kg)
Land Use (ft²/year per lb)
Lamb & Mutton
369.81
821.54
Beef (beef herd)
326.21
724.66
Cheese
87.79
195.02
Dark Chocolate
68.96
153.16
Beef (dairy herd)
43.24
96.05
Coffee
21.62
48.02
Pig Meat
17.36
38.56
Other Pulses
15.57
34.58
Nuts
12.96
28.79
Poultry Meat
12.22
27.14
Groundnuts
9.11
20.24
Milk
8.95
19.88
Fish (farmed)
8.41
18.68
Oatmeal
7.60
16.88
Peas
7.46
16.57
Eggs
6.27
13.93
Wheat & Rye
3.85
8.55
Tofu
3.52
7.82
Prawns (farmed)
2.97
6.60
Maize
2.94
6.53
Rice
2.80
6.22
Berries & Grapes
2.41
5.35
Cane Sugar
2.04
4.53
Bananas
1.93
4.29
Beet Sugar
1.83
4.06
Cassava
1.81
4.02
Wine
1.78
3.95
Barley
1.11
2.47
Other Fruit
0.89
1.98
Potatoes
0.88
1.95
Citrus Fruit
0.86
1.91
Tomatoes
0.80
1.78
Soy milk
0.66
1.47
Apples
0.63
1.40
Brassicas
0.55
1.22
Onions & Leeks
0.39
0.87
Other Vegetables
0.38
0.84
Root Vegetables
0.33
0.73
Lamb takes first place at 370 m²/kg. Beef comes in at 326 m²/kg.
Among animal proteins, poultry (12.22 m²/kg) and eggs (6.27 m²/kg) demonstrate significantly higher land efficiency than beef or lamb.
Plant proteins stay low. Peas: 7.5 m²/kg. Tofu: 3.5 m²/kg. Wheat: 3.9 m²/kg. Rice: 2.8 m²/kg. Vegetables almost always fall under 1 m²/kg.
Growing crops for people to eat directly takes much less land than raising animals. For example, one hectare of wheat can feed many more people than the same area used for cattle. If we want to protect forests and grasslands, the best way is to focus more on growing plant-based foods.