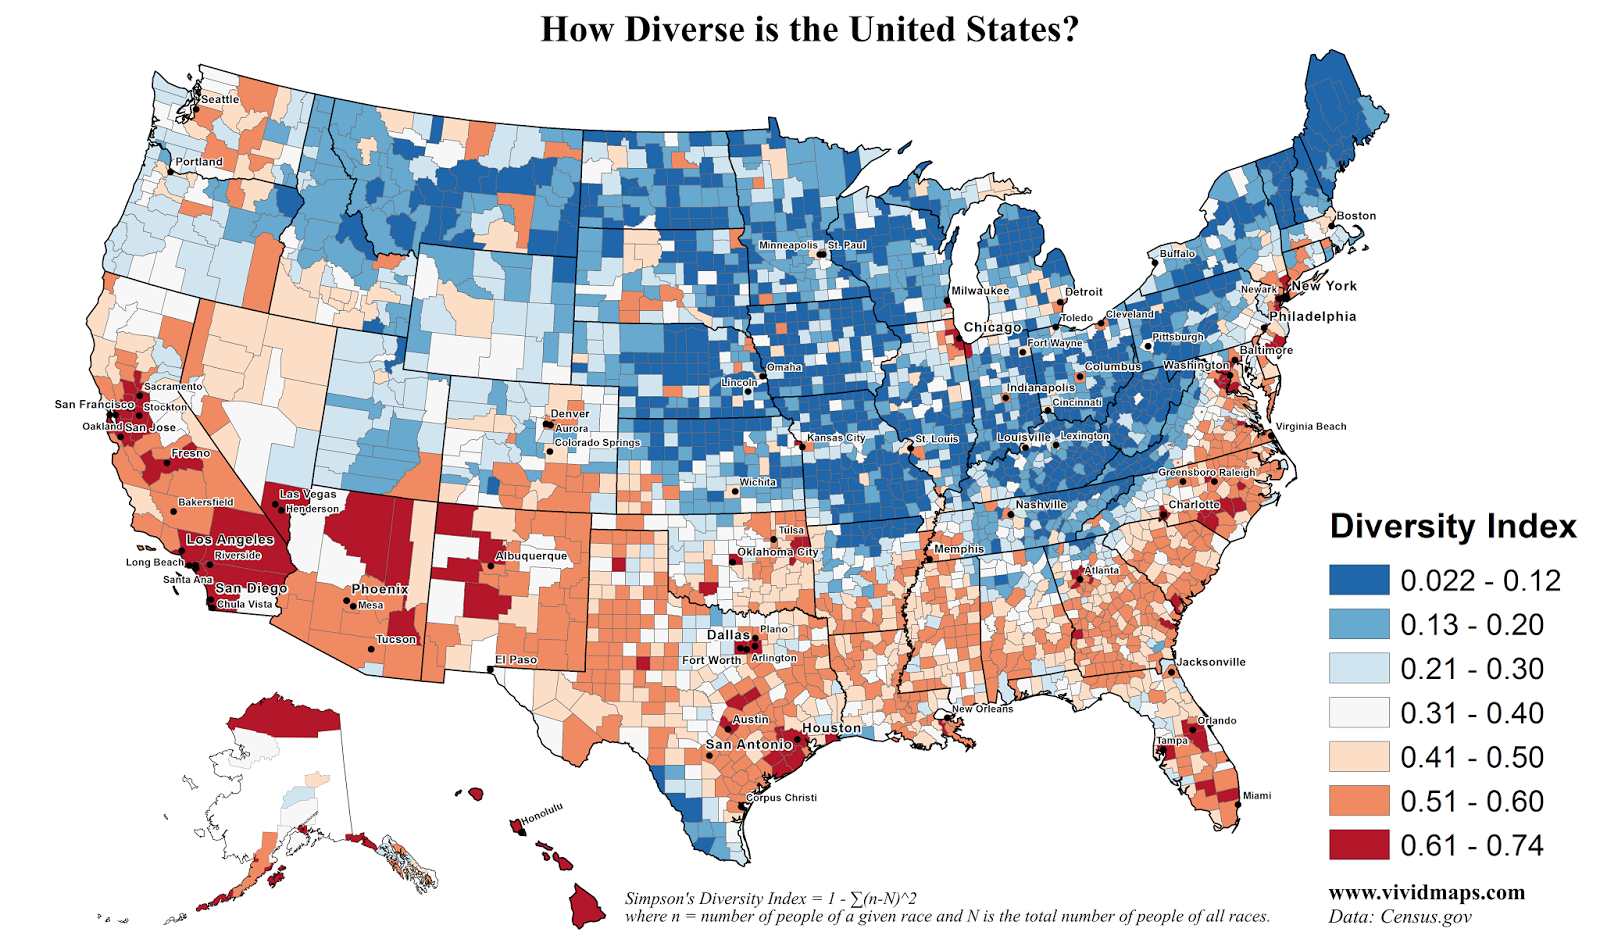
Below is a map illustrating the ethnic diversity of the United States, created using 2017 Census data.
The diversity index in this study is based on the Simpson’s Diversity Index, where we rank each county on the probability of randomly selecting two people and getting two people of different races: D =1 – ∑(n-N)^2 where n = number of people of a given race and N is the total number of people of all races.
")
?")


