One fact about Moscow is enough to send anyone to a map. No other city on Earth with 10 million or more residents lies this far north. At 55.8° N, Moscow shares a latitude band with Edinburgh and Copenhagen, yet the UN counts 14.5 million people in its built-up area. New York City, at 40.7° N, lies farther south than any point in Russia. That contrast is the reason I decided to create these maps.
Moscow is the northernmost megacity in the world, about 470 km (295 mi) farther north than London, the next one to the south.
Key Takeaways
Moscow has 14.5 million people at 55.8° N, and no other city of 10 million or more lies farther north.
It is also the only megacity with an average annual temperature below 10 °C (50 °F), at 5.4 °C (41.7 °F) against 10.6 °C (51.1 °F) in London.
Which megacities lie the farthest north?
A megacity is a city of 10 million or more people. The UN’s 2025 list has 33 of them, and only three are in Europe. For the table I took populations from the UN’s World Urbanization Prospects 2025 and average annual temperatures from WorldClim v2.1, the same climate dataset behind the maps, which averages the years 1970 to 2000.
Rank
City
Country
Latitude (°N)
Population, 2025 (millions)
Mean annual temperature, WorldClim v2.1
1
Moscow
Russia
55.8
14.5
5.4 °C (41.7 °F)
2
London
United Kingdom
51.5
10.4
10.6 °C (51.1 °F)
3
Istanbul
Türkiye
41.0
15.0
14.1 °C (57.4 °F)
4
New York City
United States
40.7
13.9
12.3 °C (54.1 °F)
5
Beijing
China
39.9
17.0
12.1 °C (53.8 °F)
6
Seoul
South Korea
37.6
22.5
12.5 °C (54.5 °F)
7
Tokyo
Japan
35.7
33.4
15.4 °C (59.7 °F)
8
Osaka
Japan
34.7
13.0
16.2 °C (61.2 °F)
9
Los Angeles
United States
34.1
12.7
17.9 °C (64.2 °F)
10
Lahore
Pakistan
31.5
15.2
24.2 °C (75.6 °F)
Paris and Harbin are not in the table. Paris lies at 48.9° N and averaged 12.8 °C (55.0 °F) in 1991 to 2020, but the UN counts 9.4 million people in its built-up area, just under the 10 million line. Harbin lies at 45.8° N and averaged 5.2 °C (41.4 °F) over the same years. This makes it colder than Moscow, which sits at 6.3 °C (43.3 °F), even though Harbin is about 1,110 km (690 mi) farther south! This happens because its winters are shaped by the Siberian High. Its 2020 census count of 10.0 million covers a whole municipality of 53,068 km² (20,490 sq mi) where about 29 percent of people live in rural areas, while its built-up area holds about 5.8 million. With no single dense urban area of 10 million, the UN does not include Harbin among its 33 megacities.
Where else on Earth is Moscow’s climate found?
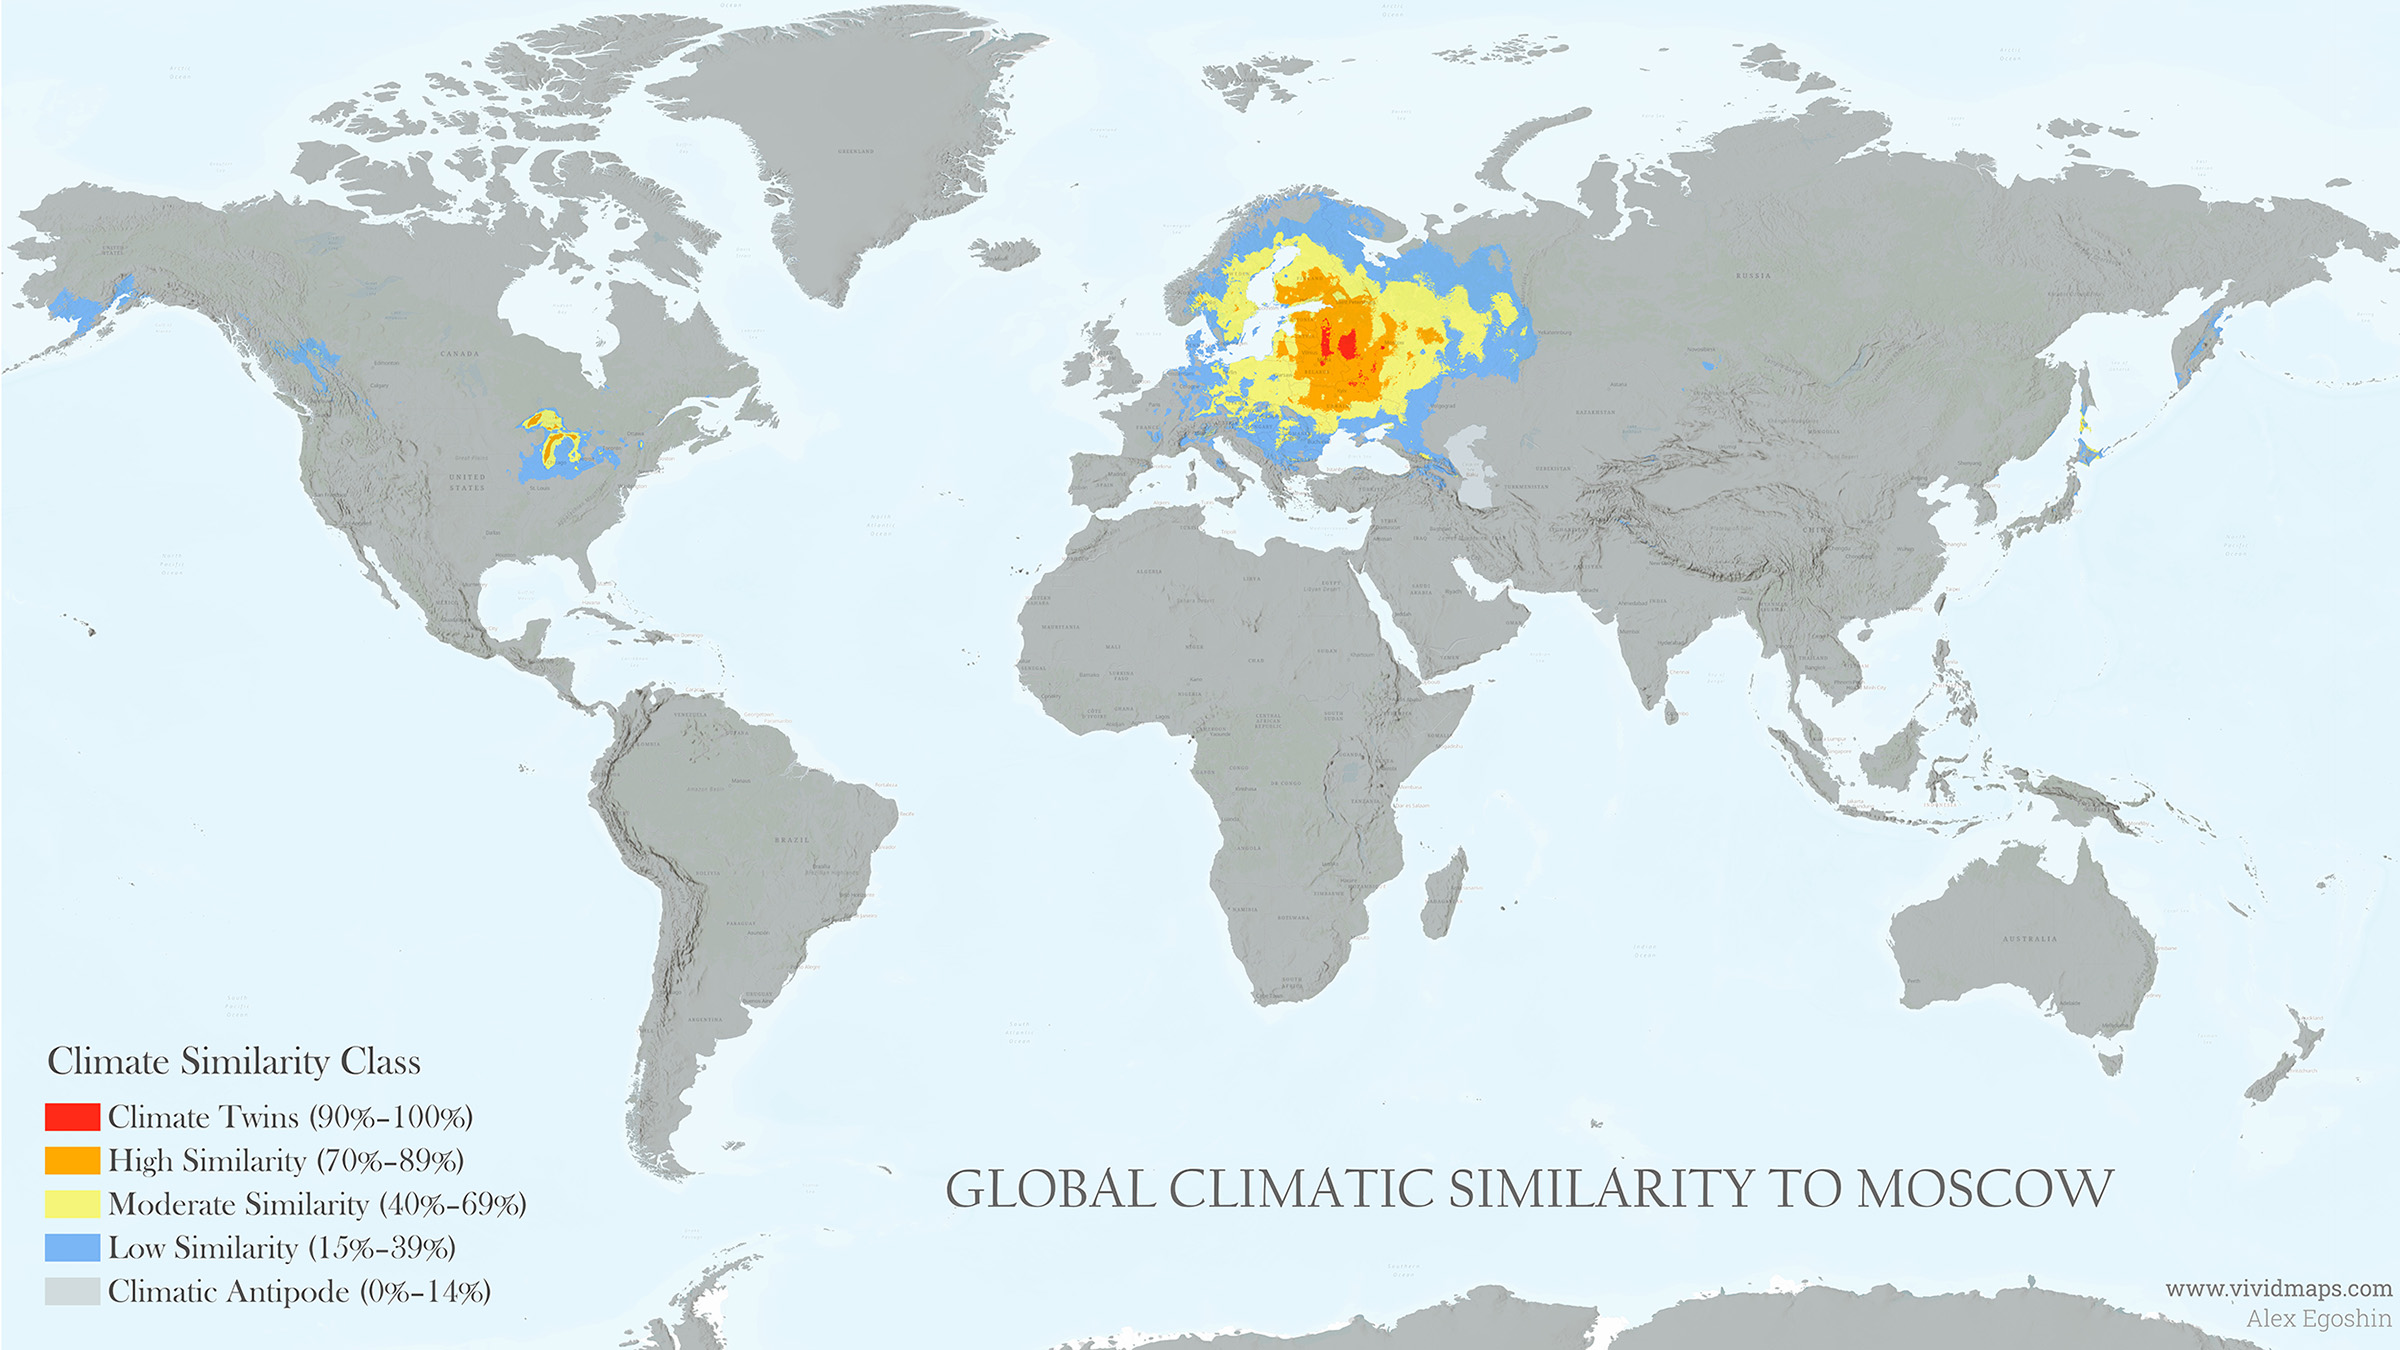
The first map shows how closely every place on Earth matches Moscow’s climate. I built it from WorldClim bioclimatic data and sorted the result into five classes, Climate Twins (90 to 100 percent similarity), High Similarity (70 to 89 percent), Moderate Similarity (40 to 69 percent), Low Similarity (15 to 39 percent) and Climatic Antipode (0 to 14 percent). The Climate Twins form a small red core in the heart of the East European Plain, wrapped in a much larger High Similarity zone. Moderate similarity spreads across Finland, southern Sweden, the Baltic region, Poland and Ukraine. Outside Eurasia, the best matches gather around North America’s Great Lakes.
How much of the planet is colder than Moscow?
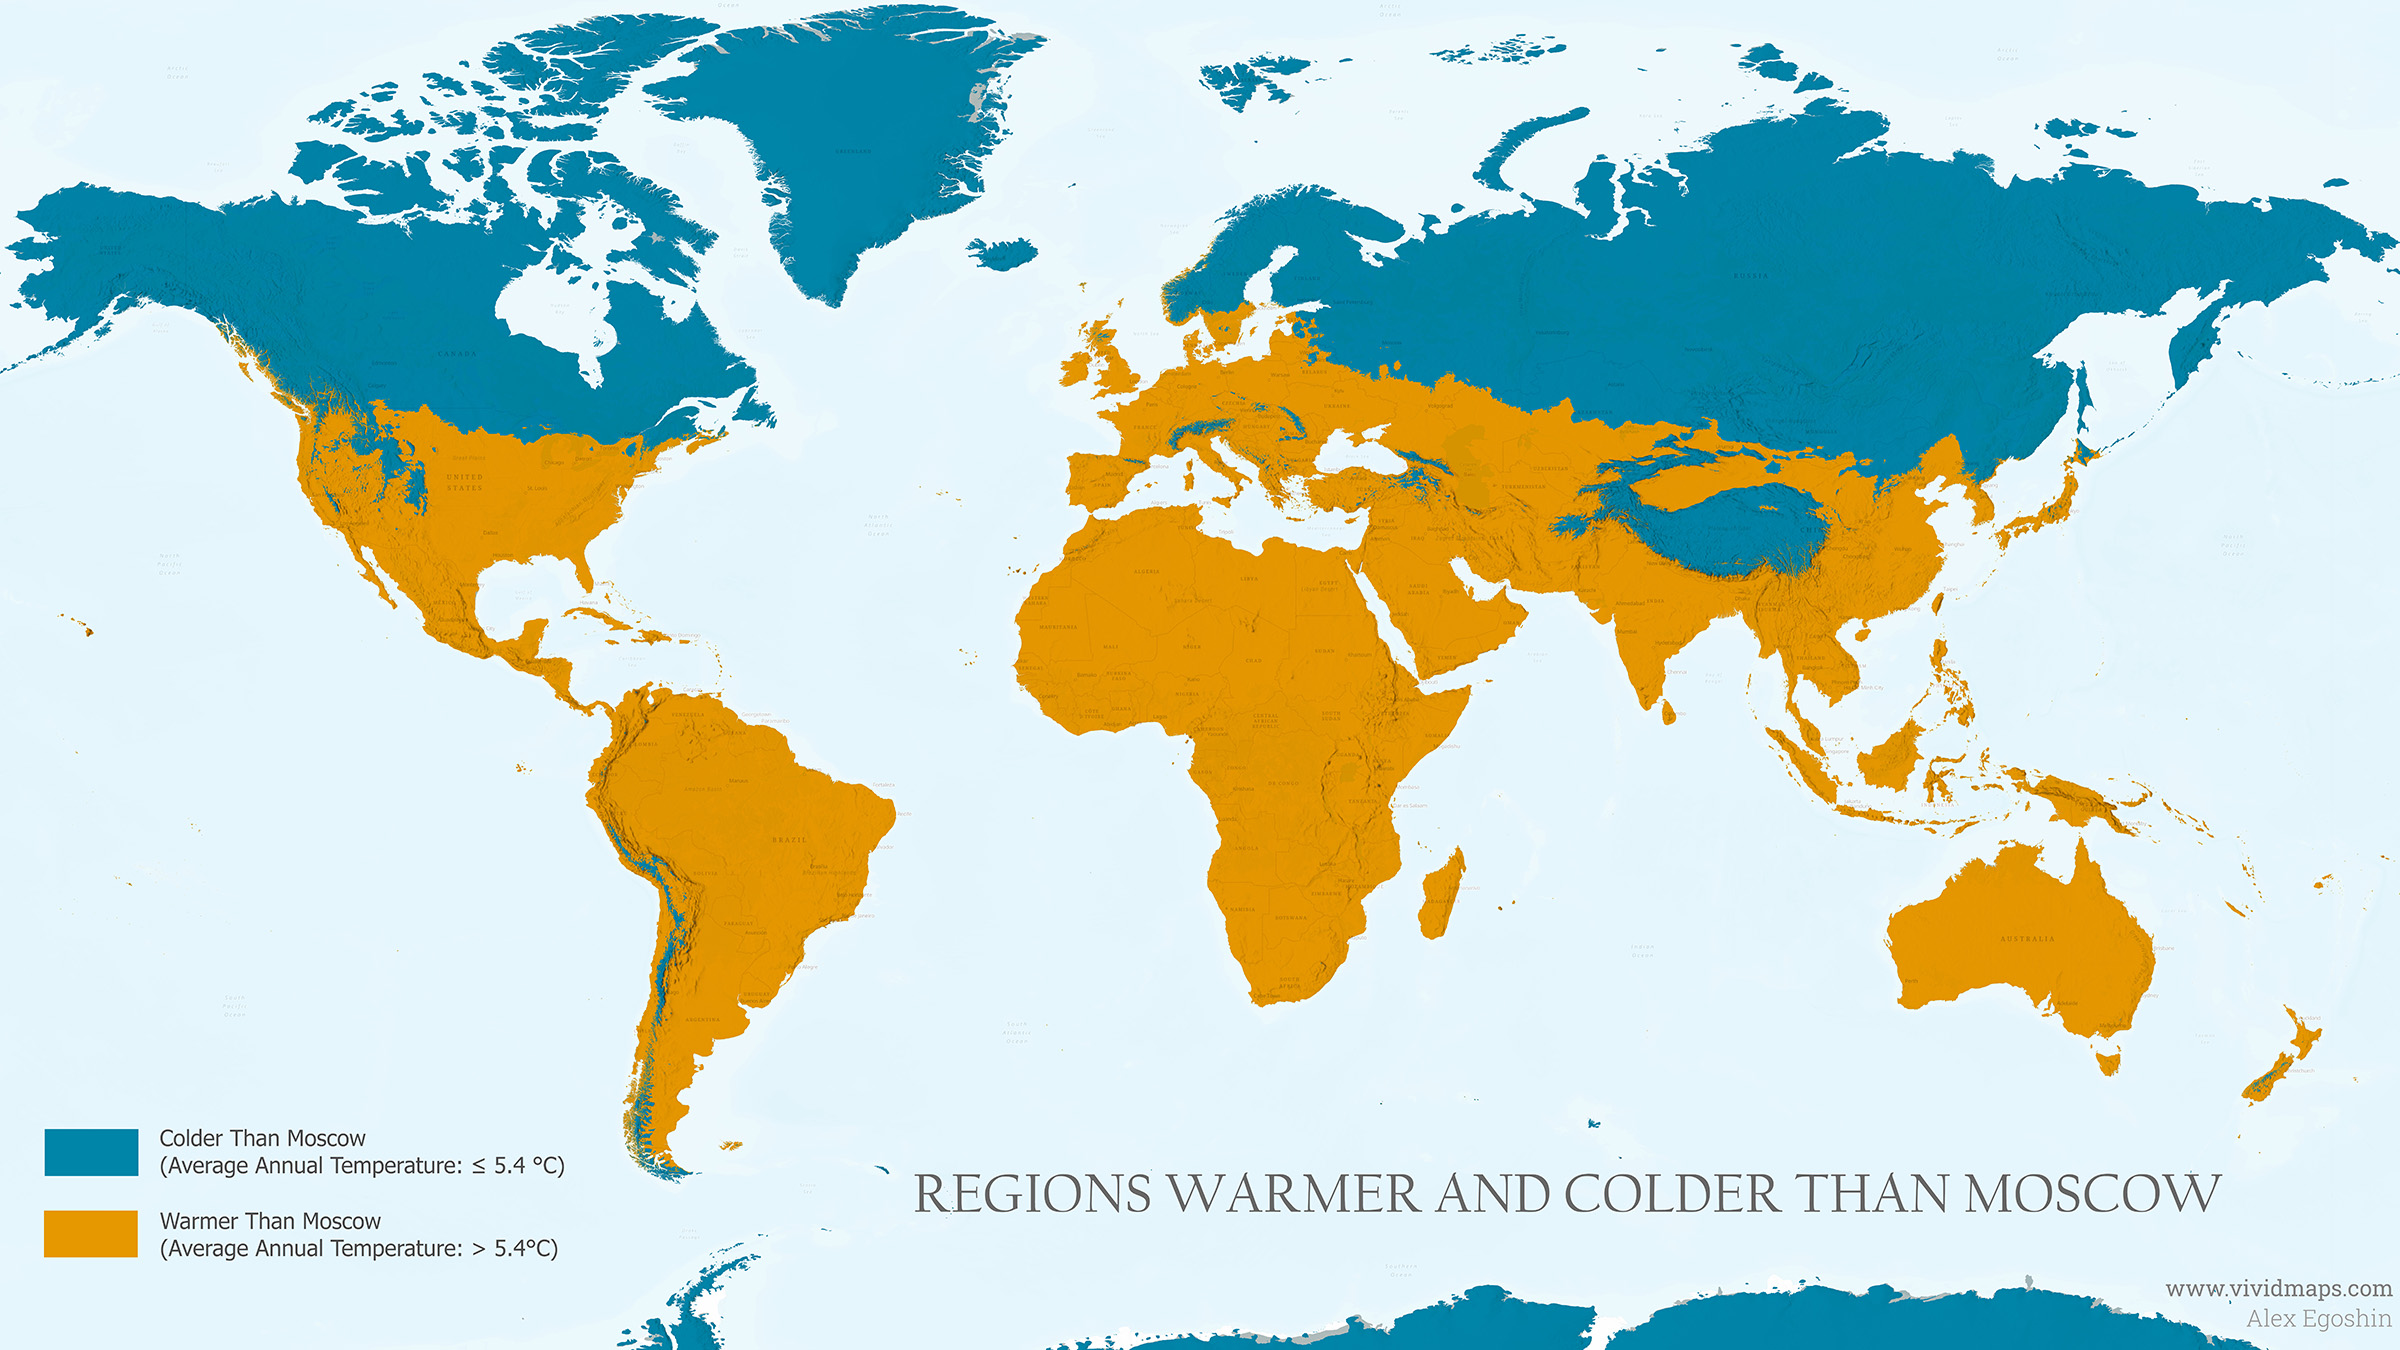
The second map is simpler. It takes Moscow’s average annual temperature in the WorldClim data, 5.4 °C (41.7 °F), and splits all land into colder (blue) and warmer (yellow) than that value. Roughly one third of the land measured is colder, and almost two thirds are warmer.
Category
Area (km²)
Area (sq mi)
Share of land measured
Colder than Moscow (5.4 °C / 41.7 °F or lower)
52,006,898
20,079,975
35.3%
Warmer than Moscow (above 5.4 °C / 41.7 °F)
95,291,952
36,792,428
64.7%
Total land measured
147,298,850
56,872,404
100%
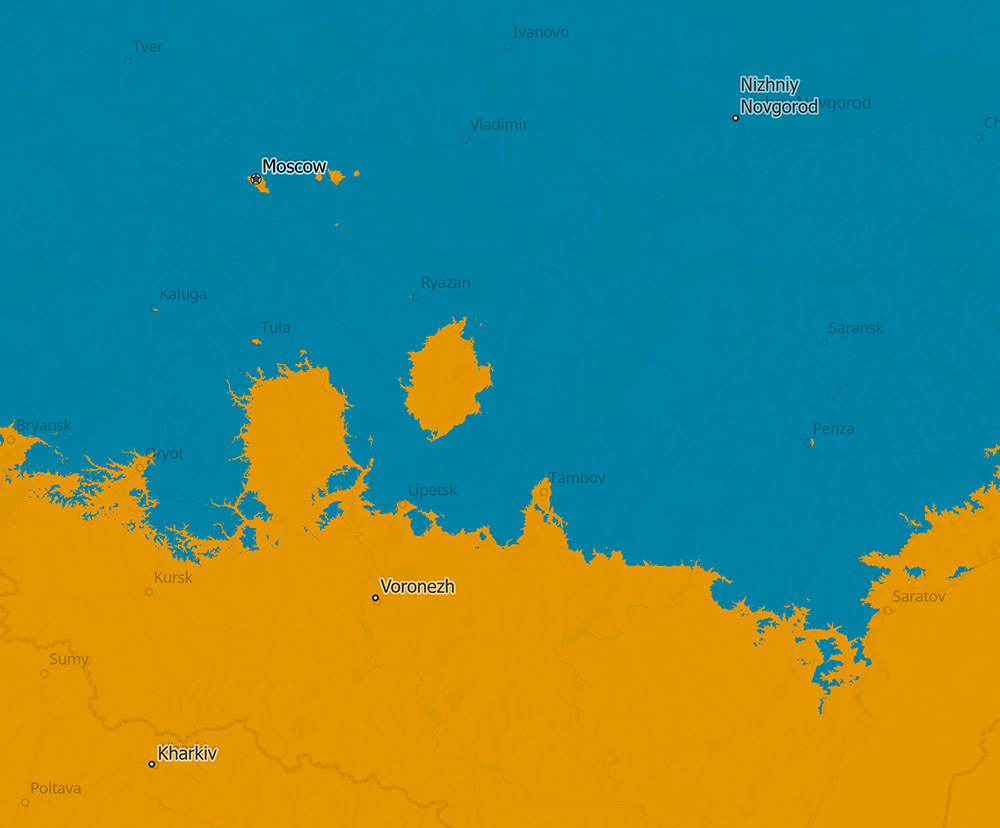
The city itself leaves a mark on this map. Moscow is large enough to behave like a heat island, and because of it the city lies almost 400 km (nearly 250 mi) north of the nearest territory with the same average annual temperature. I measured that distance with the ruler tool in ArcGIS, and the zoomed fragment below shows it. Averaged across all stations, Moscow is about 1 °C (1.8 °F) warmer than its surroundings, and the center reaches up to 2 °C (3.6 °F).
Climate does not stay constant, Moscow averaged 5.0 °C (41.0 °F) in the 1961 to 1990 norm and 5.4 °C (41.7 °F) in the WorldClim data for 1970 to 2000. The current 1991 to 2020 baseline already gives 6.3 °C (43.3 °F), and 2025 became the warmest year since observations began in 1779, at 8.6 °C (47.5 °F).
Want to keep the world in sight? Here are three beautiful maps for your wall and a globe for your desk. As an Amazon Associate, I earn from qualifying purchases.