Tracking changes to China’s northeast coastline with false-color landsat imagery
NASA and USGS’s Landsat satellites captured dramatic changes in China’s coastline at the mouth of the Yellow River from 1979
Read MoreUS News Map
US News Map allows users to search Chronicling America: Historic American Newspapers and visualize the results across space and time.
Read More24 hours of Human
One day of walking, running, cycling and transport on Human early March, 2016. Relates posts: – How cyclists commute
Read More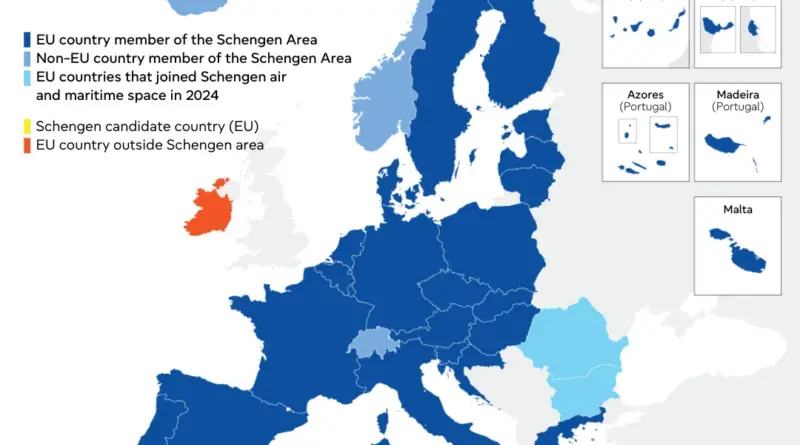
Schengen areaExploring the Schengen Area: A Map of EuropeSchengen area
Discover the Schengen Area and its unique benefits in our comprehensive guide. With a detailed map of Europe, learn how to travel seamlessly across 27 member countries, enjoy the economic and security advantages, and find the best maps available on Amazon to make your trip planning easier and more efficient. Happy exploring!
Read More
Map of most common foreign nationalities in Belgian municipalities
The size of the flag indicates the size of that particular nationality in comparison to all people of a foreign
Read More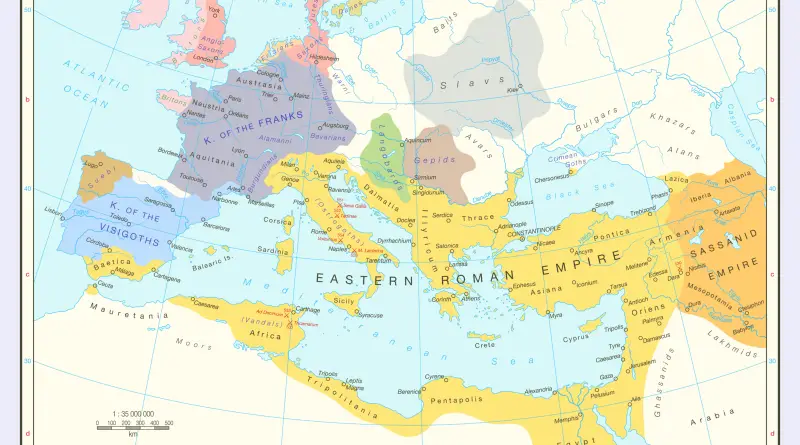
The Eastern Roman Empire
The death of Theodosius the Great in AD 395 marked the formal division of the Roman Empire, leaving east and
Read MoreNuclear detonations since 1945
This map shows nuclear detonations since 1945.
Read More
Malaria in Africa (2000 – 2015)
This map shows the modelled parasite rate for Plasmodium falciparum (PfPR2-10) for the years 2000-2015 for all African countries where
Read More