Large political map of the world, with countries labeled in their native language
Via digilicious.org
Read MoreProportion of death and disability from noncommunicable diseases (NCDs) that arises before age sixty Percent change in all communicable diseases
Read MoreVia newscientist.com
Read MoreCoal still provides 37% of the country’s electricity. Capacity & location of all coal power plants. Coal-burning power plants are
Read MoreChristianity is the most prevalent religion in the U.S.; about 70% of adults in the U.S. identified themselves as Christians. Protestant denominations are considered for approximately 49% of the population. After Christianity, Judaism is the next most populous religious association in the country.
Read More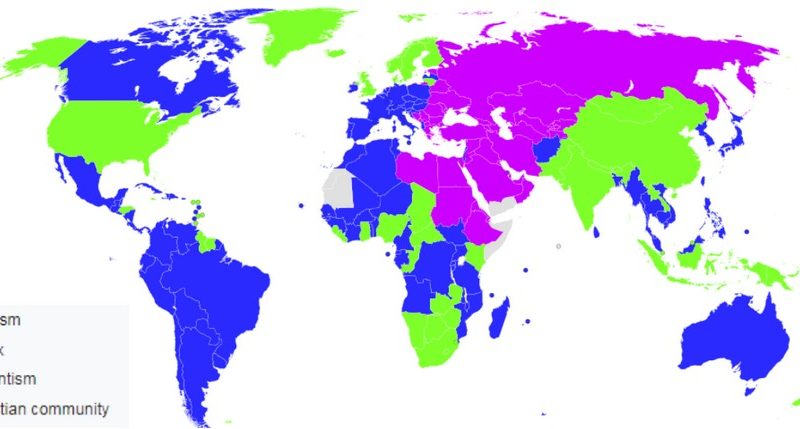
Dive into the intricate tapestry of global Christianity with our comprehensive world map analysis. From population percentages to dominant sects, we examine the current state and future projections of the world’s largest religion.
Read MoreEurope Asia North America South America Oceania
Read More