The average age in Germany according to the latest issue of “die Zeit”
The median age of Germans in 2017 was 47.1 years (male – 46.0; female – 48.2 years), implying that half
Read MoreThe median age of Germans in 2017 was 47.1 years (male – 46.0; female – 48.2 years), implying that half
Read More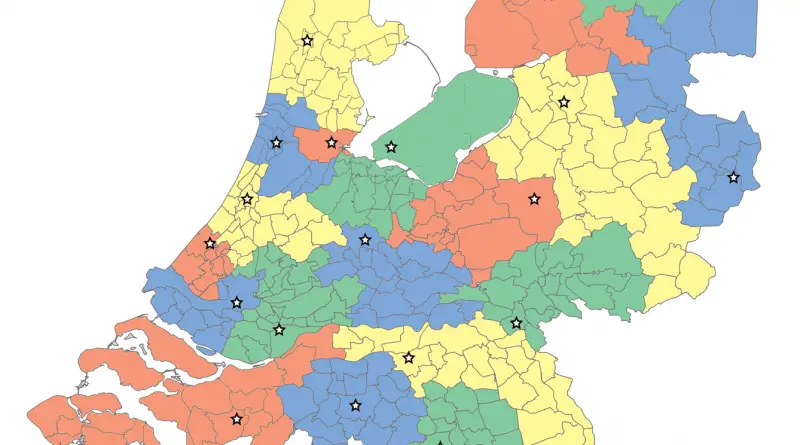
Delve into the unique aspects of population density in the Netherlands, one of Europe’s most densely populated countries. From the bustling urban areas of the Randstad to the innovative solutions like floating homes and vertical living, discover how the Dutch manage their crowded land efficiently and sustainably. Learn about the historical factors, current challenges, and future outlook of this compact yet thriving nation.
Read MoreAustralia includes 6 states: New South Wales (Population: 8 million; Area: 0.8 million sq km), Queensland (Population: 5.1 million; Area:
Read More
From 1778 to 1871, the U.S. signed 368 treaties with different indigenous tribes across North America. These treaties were based on the fundamental concept that each Native American tribe was a sovereign nation. But as white immigrants started moving onto Indigenous American lands, this concept confronted the rigid pace of westward expansion. As a result, many promises were broken by the U.S. government.
Read More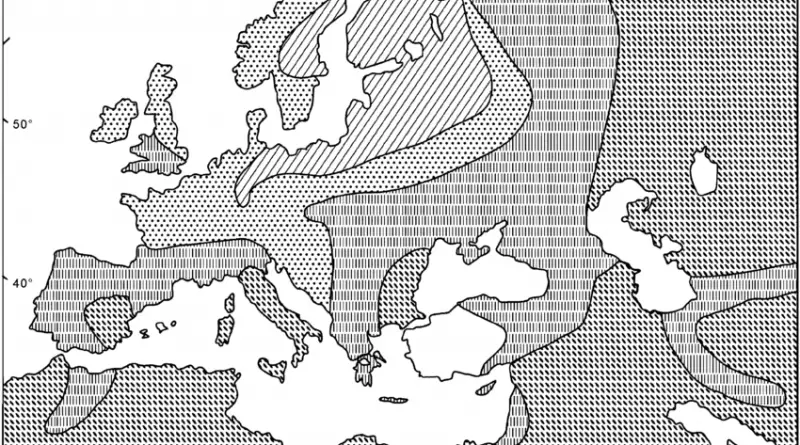
The likelihood of having light-colored eyes in Europe is notably higher compared to many other regions of the world. This prevalence can be attributed to a combination of historical, genetic, and environmental factors.
Read MoreAgricultural suitability is a subset of land suitability and focuses on which are the areas of land best suited for
Read More
Over the next decades, it is predicted that billions of people, especially those in developing nations, face deficits of water
Read MoreEurope had the 2nd highest proportion of obese people, behind North and South America. Globally, in 2014, 39 percent of men and 40 percent of women aged 18 or over were overweight. Almost 1 adult in 6 in the European Union is considered overweight.
Read More
From the middle of the nineteenth century, Japan began to see a colonial empire on the Western-type as one of the traits of state power and political modernity.
Read MoreCountries with coastlines have jurisdiction over nearby waters, deciding to open some economic activity and to protect others from possibly
Read More