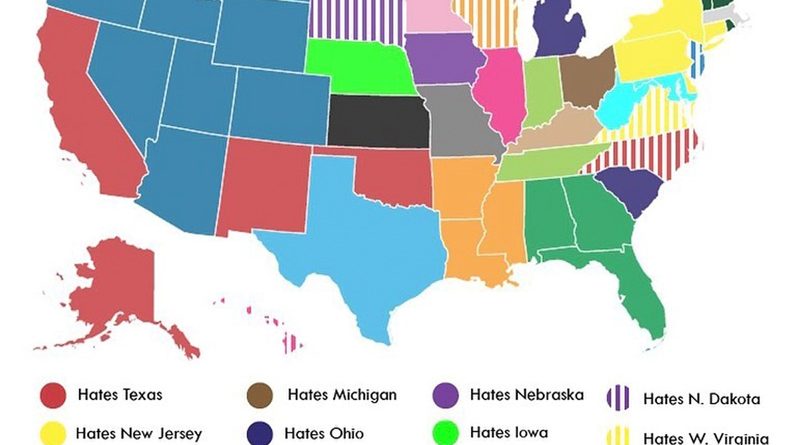
The most and least favorite US state of each state mapped
Instagram user Matt Shirley asked his 300 thousand followers to vote on which US state their home state liked and disliked the most.
Read MoreMaps of the US
Instagram user Matt Shirley asked his 300 thousand followers to vote on which US state their home state liked and disliked the most.
Read More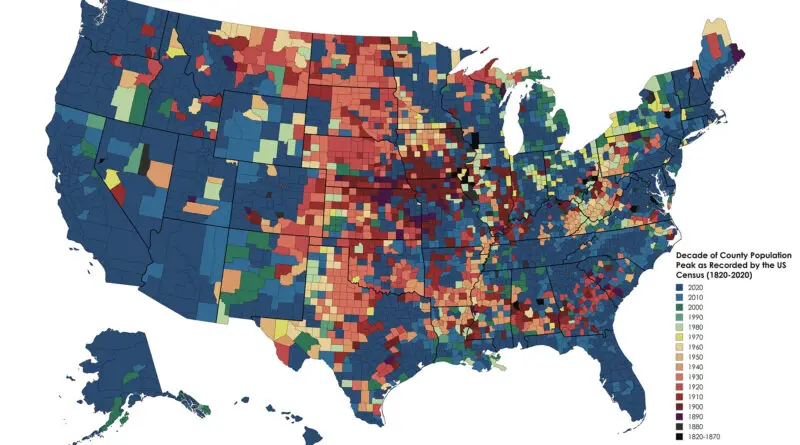
The demographic history of the United States is a rich tapestry woven with diverse threads of immigration, migration, settlement patterns, and socio-economic changes. Since its inception, the U.S. population has experienced dynamic shifts, shaped by various factors such as colonization, westward expansion, industrialization, and globalization.
Read More
The breakdown of Russia formed Poland, Finland, Estonia, Latvia Lithuania. The Austro-Hungaria separated into Austria, Czechoslovakia, Hungary, and Yugoslavia. The Ottoman Empire lost much of its territory in the Middle East and southwest Asia. Germany lost considerable territories outside Europe.
Read More
The Asian population in the United States grew to almost 12 million by 2000 and approximately doubled to 22.5 million by 2019 (7% of the U.S. population). The Asian population in America is predicted to touch 46 million by 2060, outdoing Hispanics in 2055.
Read More
China has grown the world’s greatest trading country, replacing the U.S. from its usual dominance as a trading partner for other nations around the globe.
Read More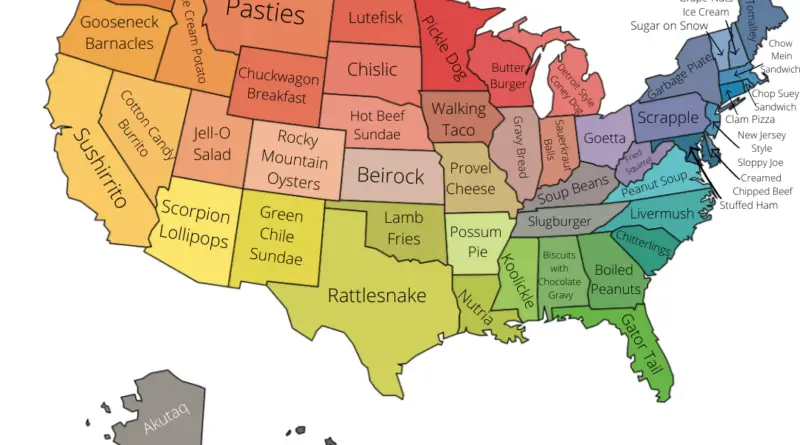
The U.S. is a vast country. A wide range of topography, climates, culture, political views, social norms, traditions can vary significantly from state to state. It is not surprising that every state has its unique manner of cooking and some food varieties you would never expect!
Read More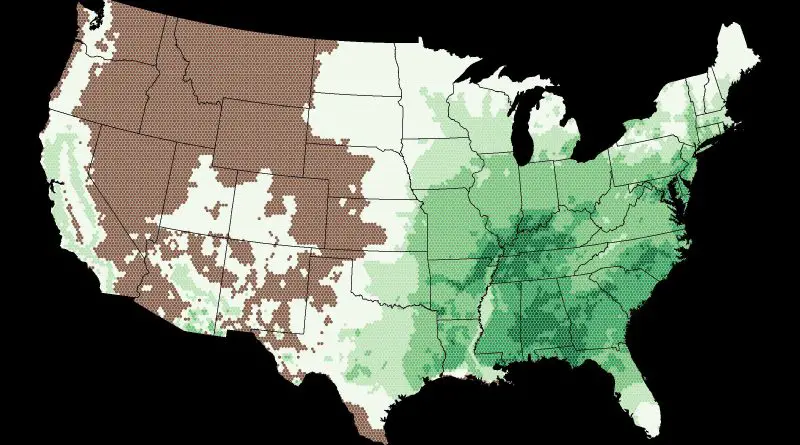
North America contains the most significant number of oak species, with around 90 growing in the U.S., while Mexico has 160 species, of which 109 are endemic. In the United States, the highest diversity of oak species occurs in the eastern states.
Read More
Hispanic are Americans who are the posterity of immigrants from Spain or Latin America. Hispanics generally are the leading minority ethnic group in the U.S., after non-Hispanic white Americans. According to U.S. Census Bureau data, in 2020, Hispanics made up 18.7% (62.1 million) of the U.S. population.
Read More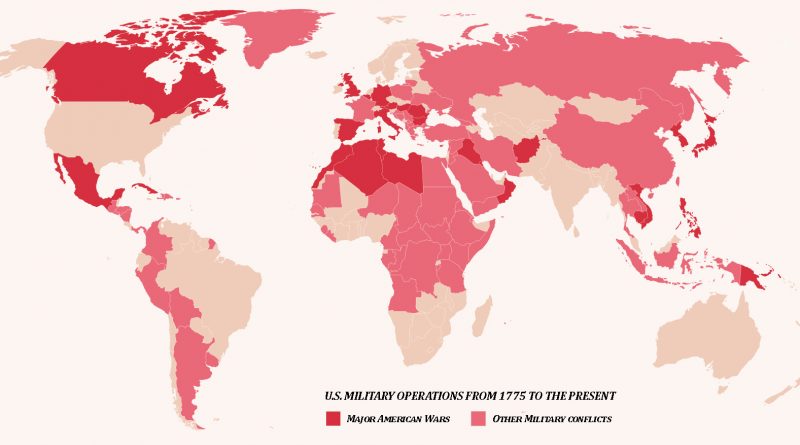
The United States has had a military presence worldwide, from the practically first day of its sovereignty. The U.S. has been implicated in many foreign invasions during its history. The United States invaded twenty-two countries just in the last 20 years.
Read More
Black Americans compose the 2nd-largest racial group in the United States, after White Americans and Hispanic Americans. African Americans make up 14.6% (47.8 million) of the U.S. population. In recent decades, there has been an increase in U.S. counties with a predominance of blacks.
Read More