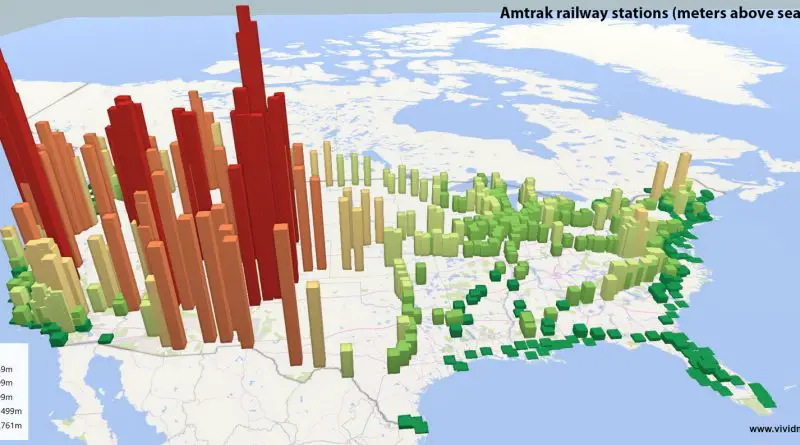
Changing views of the US in the EU (2016 – 2017)
Percentage point change in those who held a positive view of the United States. Reddit user bezzieford, Data: Eurobarometer 2017
Read MoreMaps of the US
Percentage point change in those who held a positive view of the United States. Reddit user bezzieford, Data: Eurobarometer 2017
Read MoreA map shows how Americans view other nations—friends, foes, or unfamiliar. It’s a glimpse into global opinion shaped by history, politics, and perception.
Read MoreWhat happens when you map the fastest way to drive from the center of the U.S. to every county? This post explores a mesmerizing visualization that turns America’s road network into something resembling a river system, all flowing outward from Kansas.
Read MoreFrom 2015 to 2025, artists and media outlets created revealing maps showing Donald Trump’s perspective on the world. This collection of satirical cartography, featuring works from The New Yorker, HuffPost, and political cartoonists, charts the evolution of Trump’s global outlook through data and wit.
Read MoreEver wonder why some U.S. regions experience massive temperature swings while others stay remarkably stable? A fascinating NOAA-based map reveals Colorado’s staggering 69°F (38°C) difference between summer highs and winter lows, while coastal areas like Southern Florida maintain gentle 20-30°F (11-17°C) variations. From Death Valley’s record-breaking 134°F (56.7°C) to Hawaii’s steady 15-20°F (8-11°C) range, discover what creates these dramatic climate differences and how they’re projected to intensify over the coming decades.
Read MoreA closer look at the U.S. Senate’s evolution from 1789 to 2018—complete with an animated map showing political changes, long vacancies, and the structure of the chamber itself.
Read MoreHow safe is your state? Our analysis of the 2025 U.S. News & World Report public safety rankings uncovers unexpected trends across America. Through interactive maps, we discover why New England tops the safest states and some others struggle with ongoing problems.
Read MoreMore than half of Nevada’s 3.2 million people live in the Las Vegas area, with Clark County alone housing about 2.34 million. New stats and local insights ahead.
Read MoreA diverse population has impacted history in the U.S. from the very beginning. From the first travelers and colonists to the modern-day, the United States has been a country of immigrants. Many groups have combined to shape America’s history and give the society that the country has today. Therefore, differences between U.S. states and territories can be significant.
Read MorePopulation density of adherents of religions, 1890 – 2010 Population density of adherents, 2010 Alex Egoshin, www.vividmaps.com Related posts:– Faithland
Read More