Camellia sinensis is the evergreen shrub behind nearly every cup of tea drunk today, native to the borderlands where southwestern China meets northern Myanmar. Chinese legend credits Emperor Shennong with discovering it by accident around 2737 BC, when a few leaves blew into his pot of boiling water. The earliest confirmed written references to tea drinking date to China’s Shang dynasty, well over a thousand years later, when it served as a medicinal preparation rather than a daily habit.
Camellia sinensis
Tea stayed inside East Asia for centuries after that. A Dutch trading ship carried the first commercial shipment from Macau to Amsterdam in 1610, where European buyers treated it as a costly curiosity. Two more centuries passed before the British East India Company broke China’s export monopoly, planting the Assam variety commercially through the 1830s and 1840s. Colonial plantations across India, Ceylon, and later East Africa turned tea into a global commodity, and it remains the second most consumed beverage on earth after water.
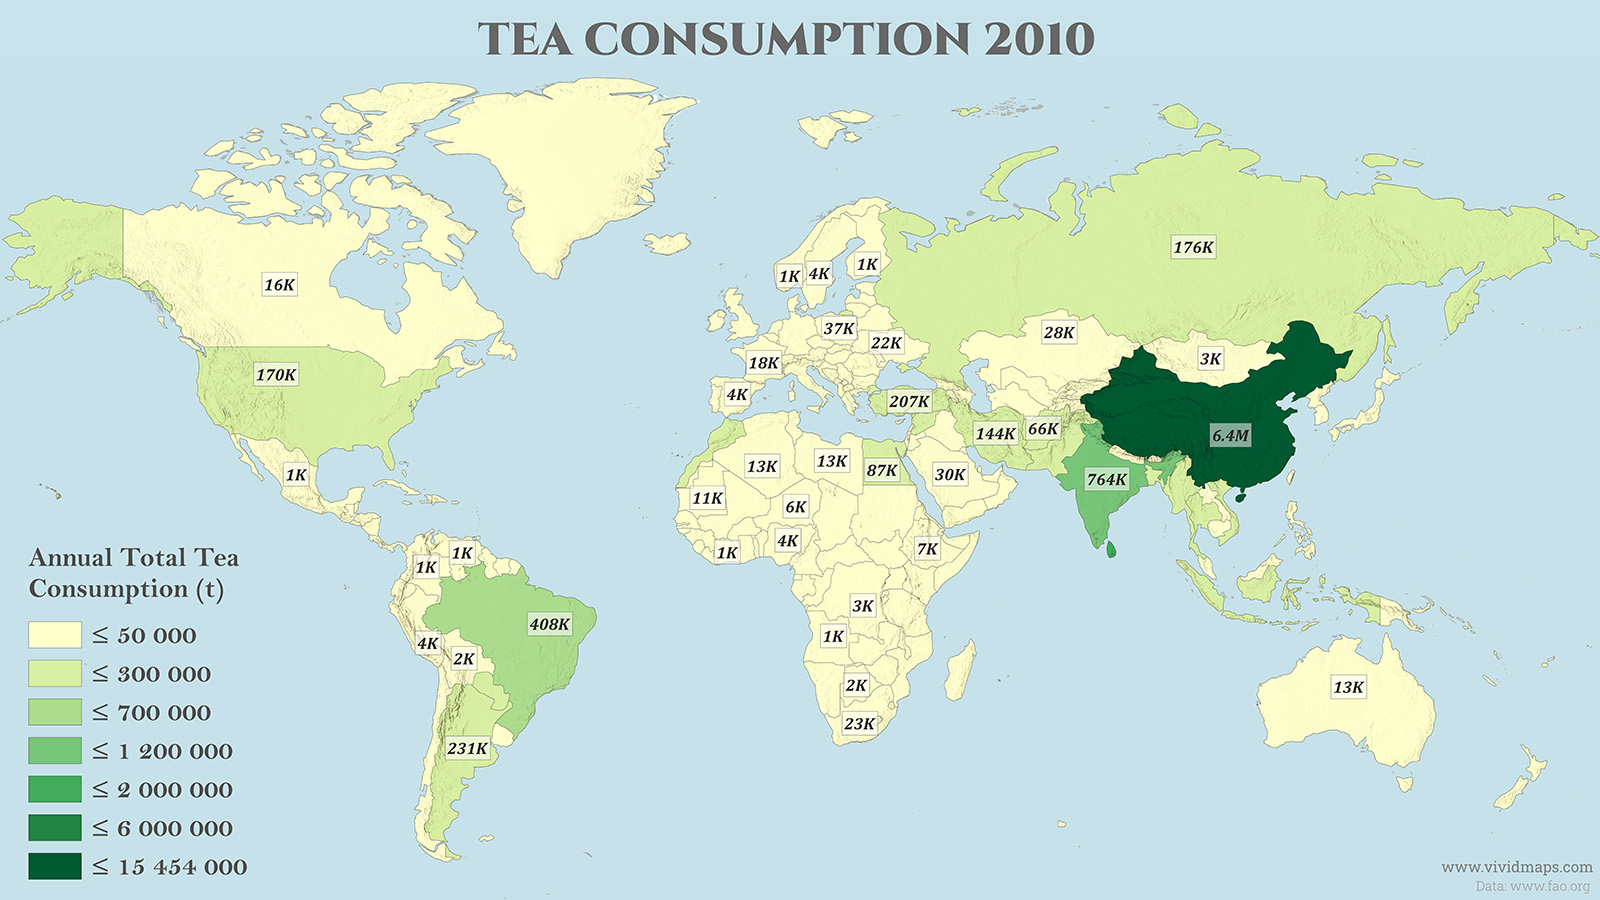
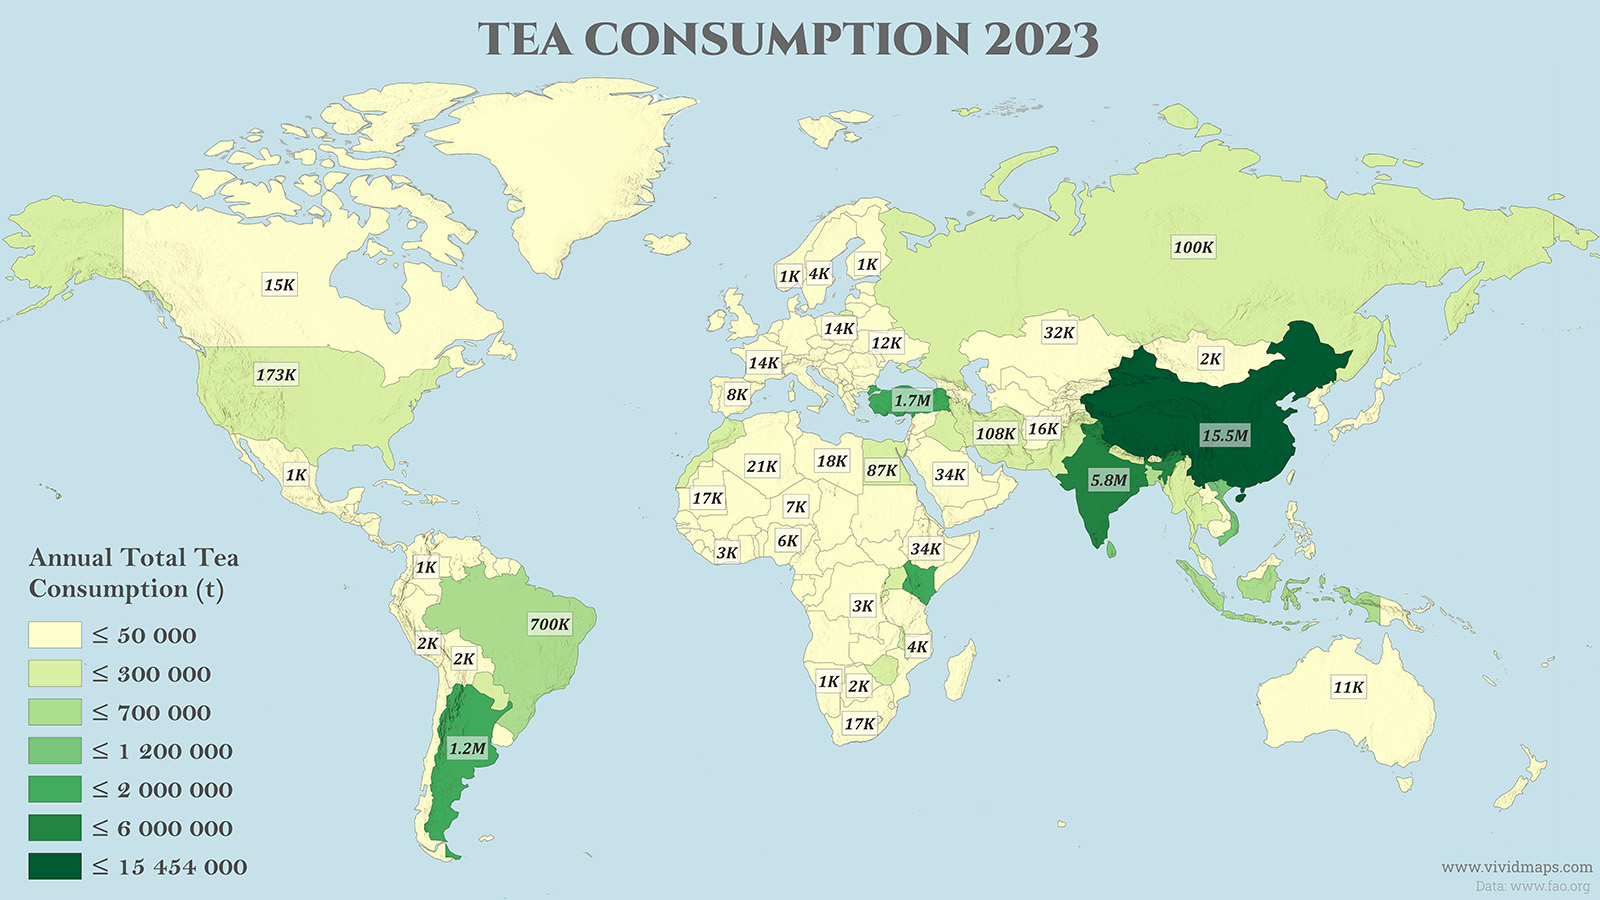
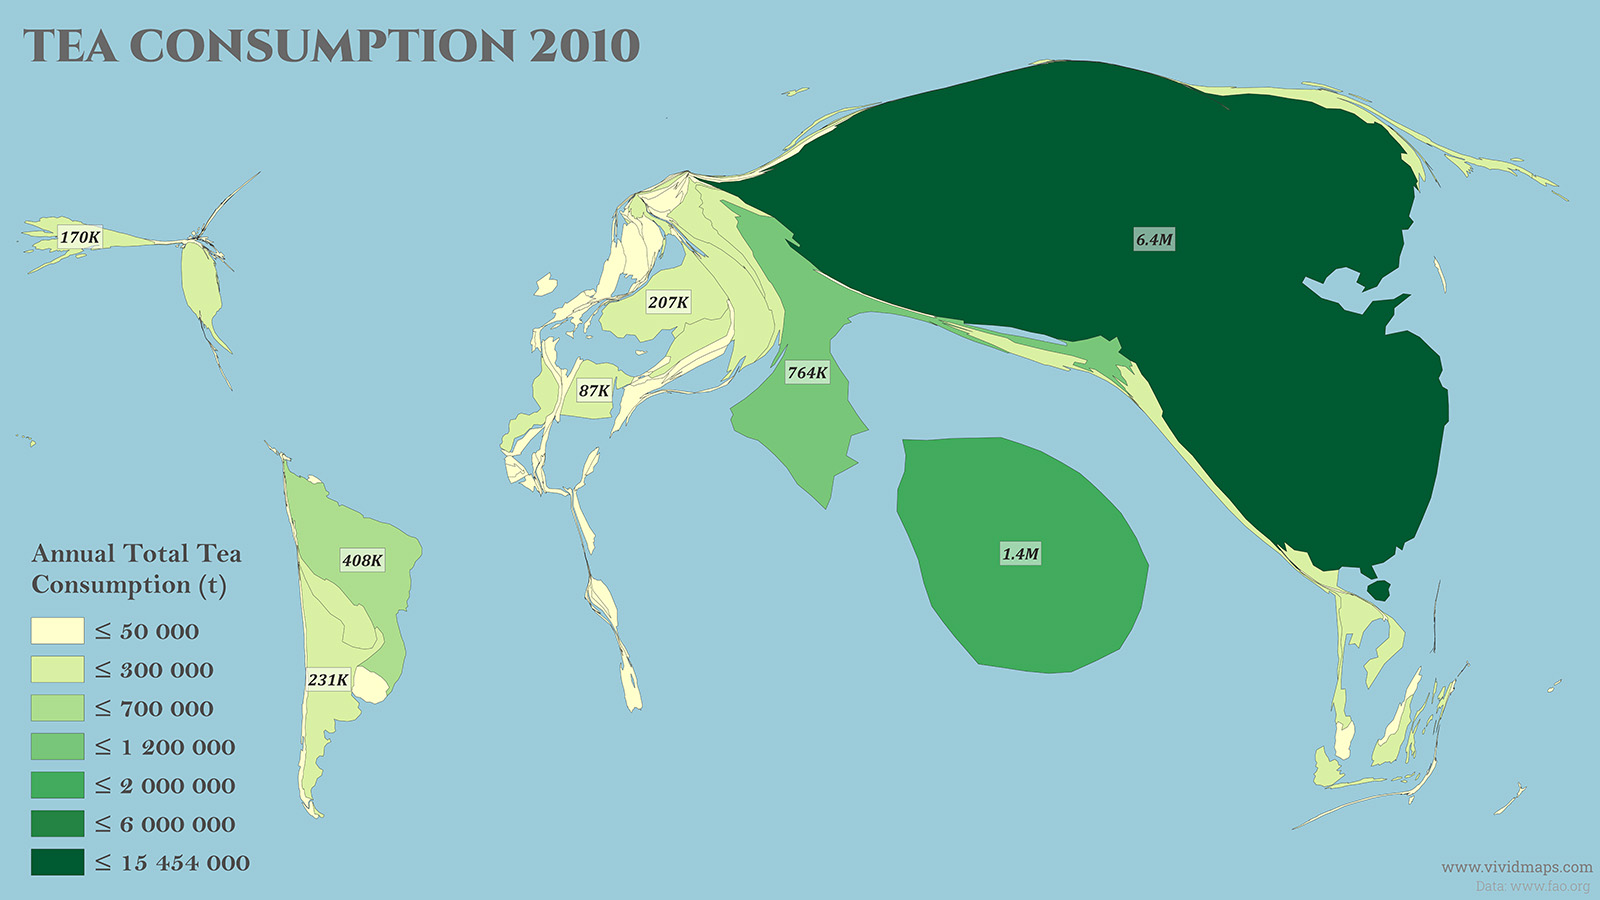
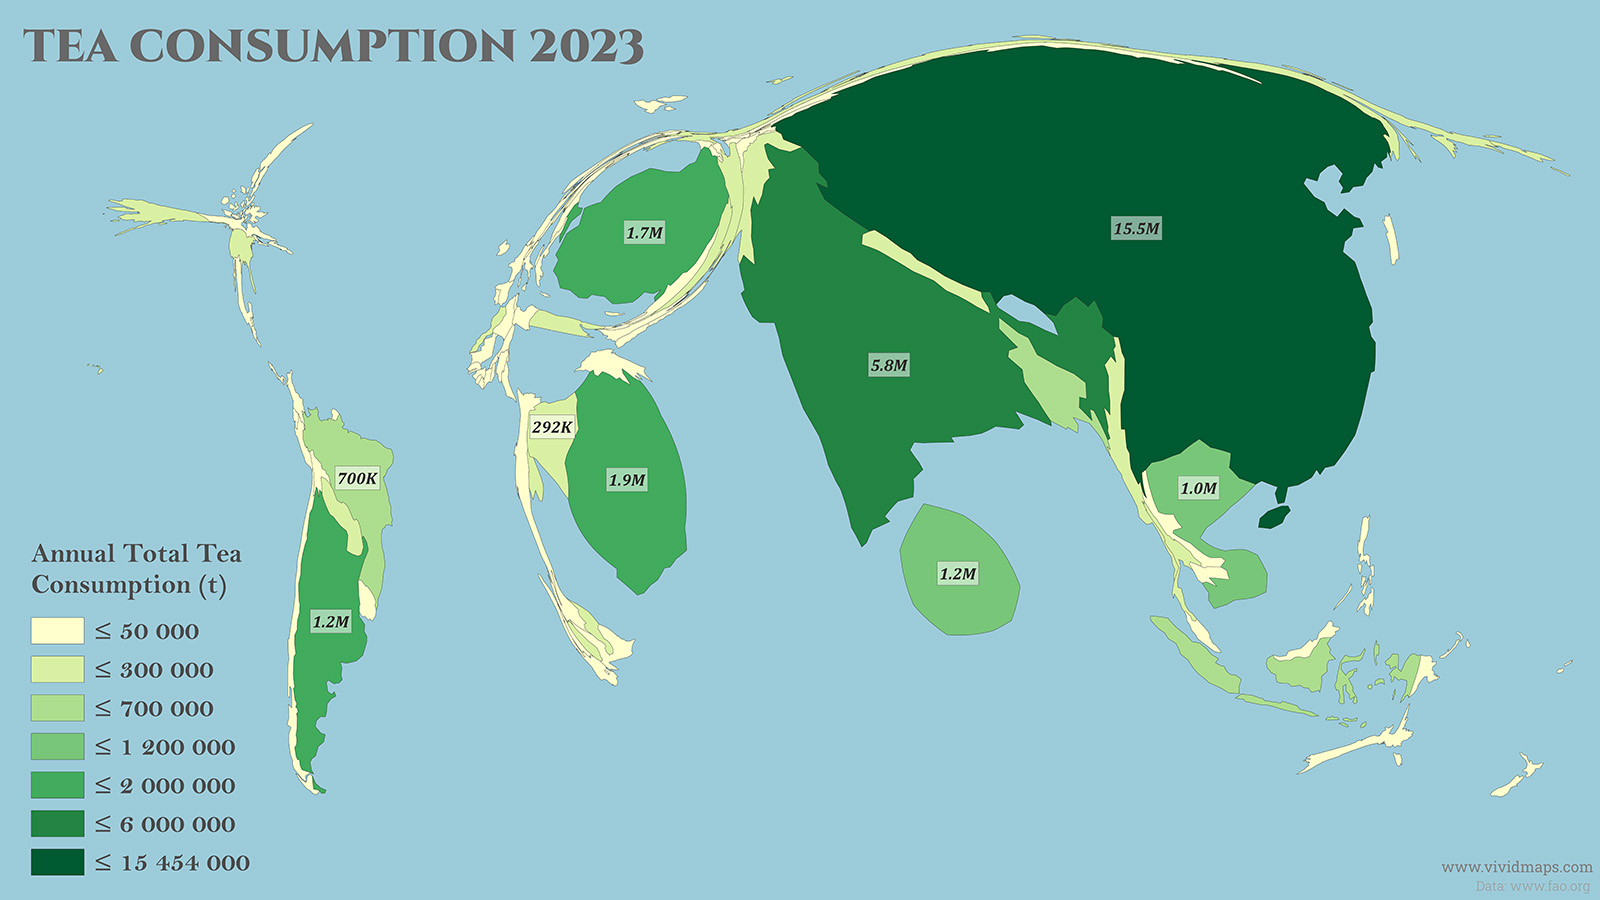
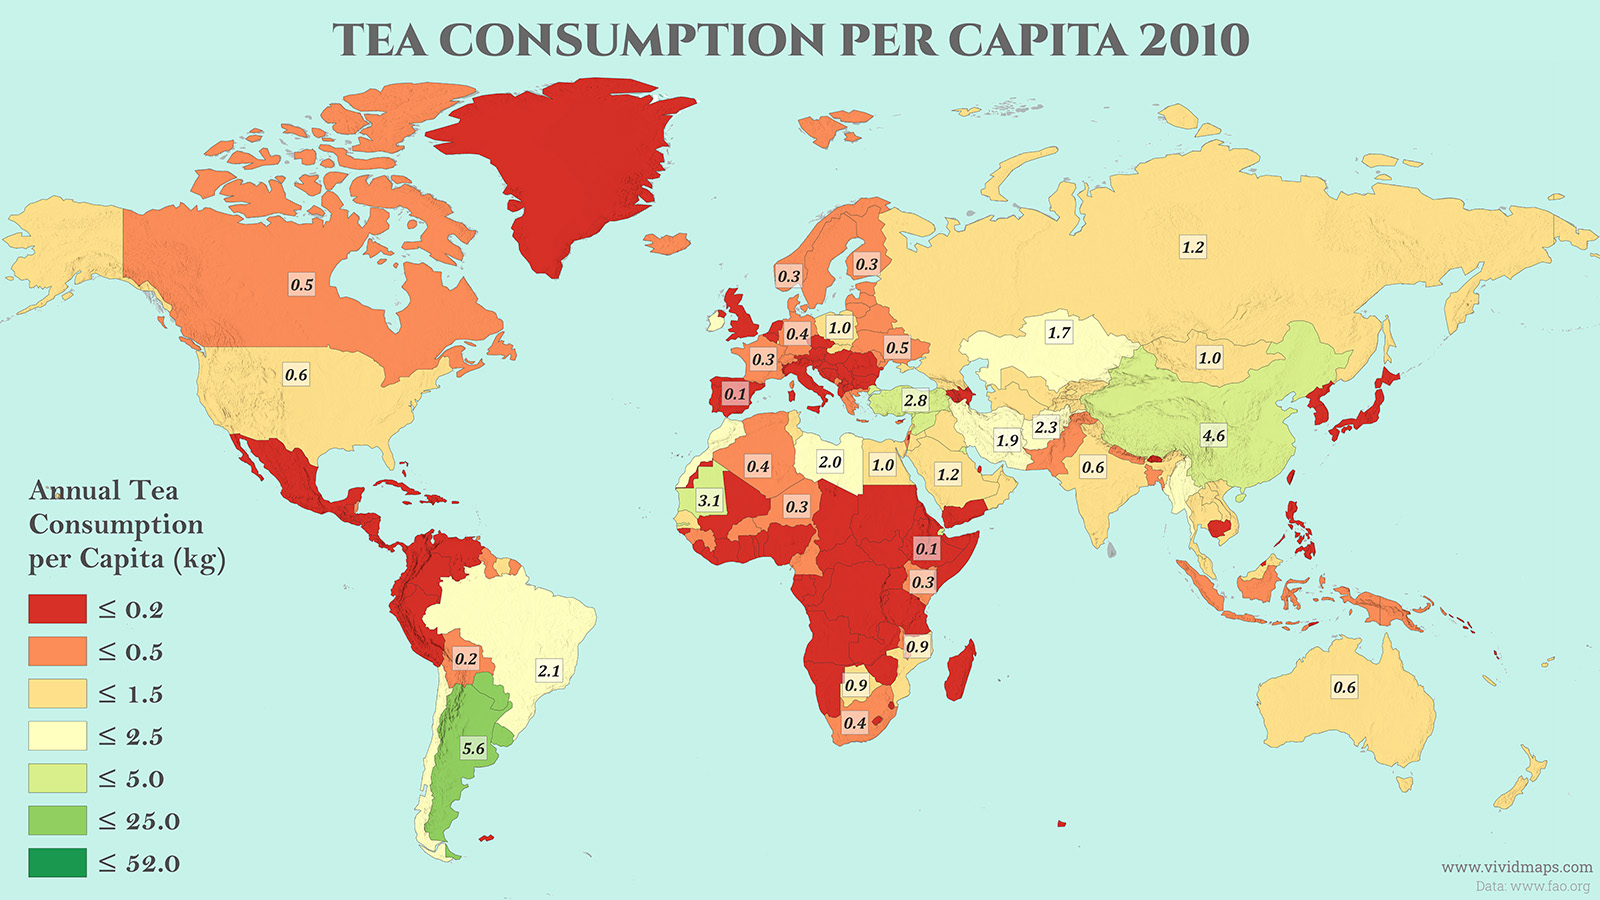
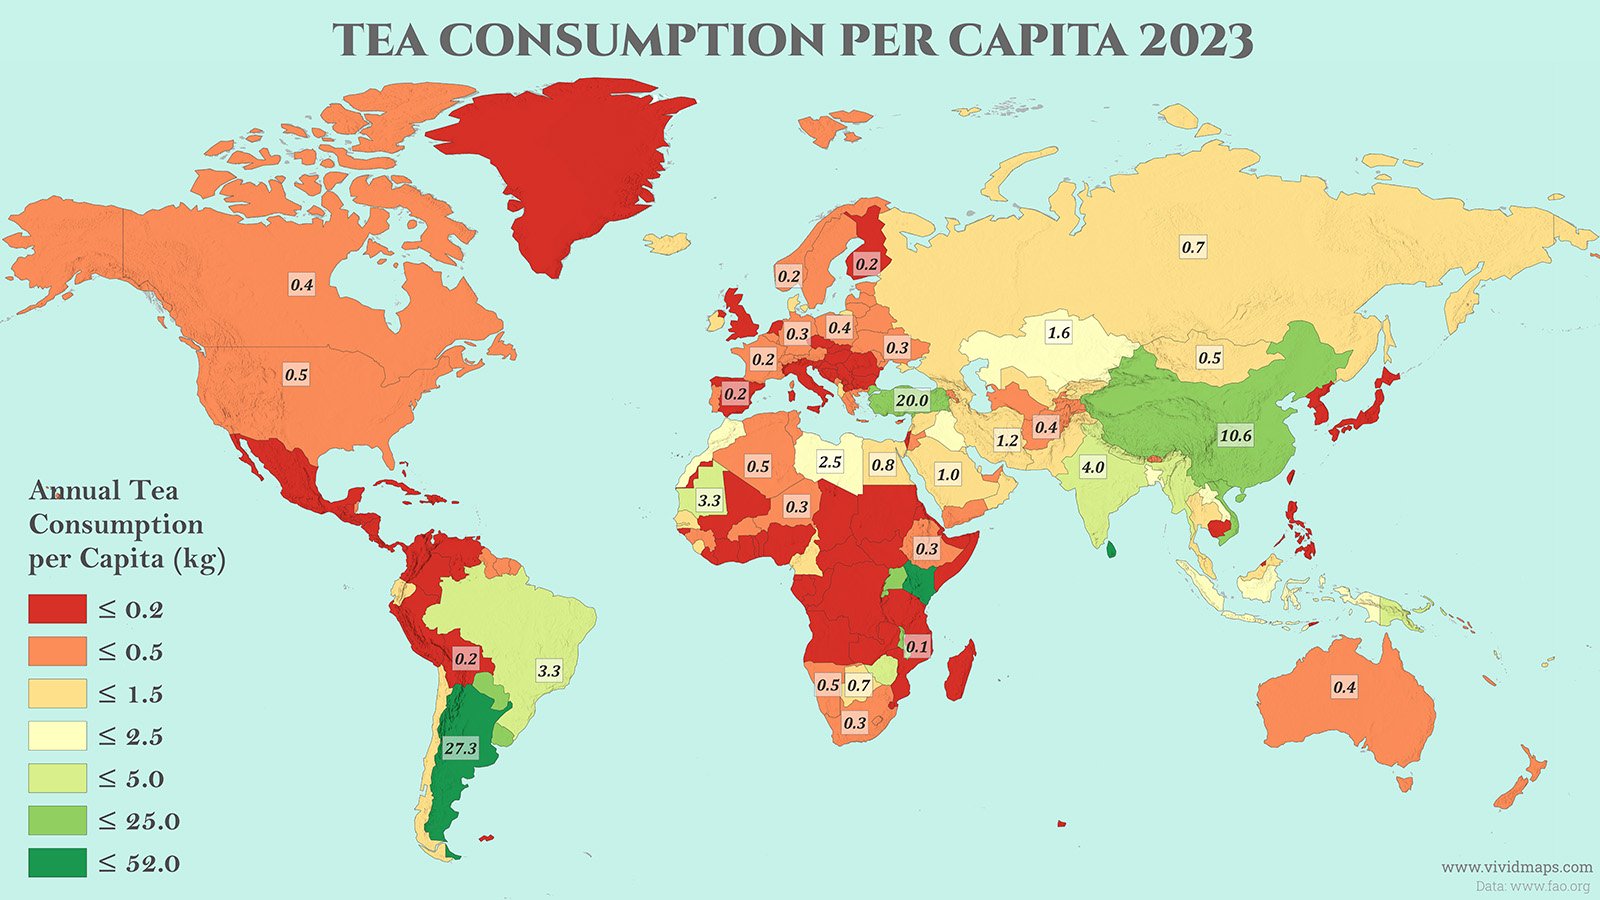
The maps below draw on FAOSTAT data, covering 178 countries in 2010 and 2023. FAO records tea using primary equivalent weights. For tea, the primary product is defined as withered, rolled, and dried leaf, essentially processed loose tea rather than fresh leaf. The category also folds in yerba mate, which is why Argentina and Paraguay carry unusually high per capita numbers further down.
Global tea and mate supply grew from 11,476 thousand tonnes in 2010 to 33,091 thousand tonnes in 2023, close to a threefold rise in thirteen years. China supplied 15,454 thousand tonnes in 2023, about 17 million tons, up from 6,360 thousand tonnes, and alone accounts for close to half the current world total. India climbed from 764 to 5,772 thousand tonnes. Turkiye grew from 207 to 1,744 thousand tonnes. Vietnam went from 63 to 1,045 thousand tonnes, among the fastest expansions in the entire dataset.
A smaller group of countries moved the other direction. Russia’s supply fell from 176 to 100 thousand tonnes, a decline that deepened after the 2022 invasion of Ukraine disrupted shipping routes and complicated payments to Indian and Sri Lankan exporters. The United Kingdom dropped from 121 to 84 thousand tonnes. Afghanistan fell hardest in relative terms, down from 66 to just 16 thousand tonnes.
Total Tea and Mate Supply by Country (thousand tonnes)
Country
2010 (1,000 t)
2023 (1,000 t)
Change
China
6,360
15,454
143.00%
India
764
5,772
655.50%
Kenya
14
1,925
13650.00%
Türkiye
207
1,744
742.50%
Argentina
231
1,241
437.20%
Sri Lanka
1,443
1,187
−17.7%
Vietnam
63
1,045
1558.70%
Brazil
408
700
71.60%
Indonesia
77
592
668.80%
Bangladesh
54
406
651.90%
Uganda
0
292
N/A
Pakistan
93
236
153.80%
Malawi
4
191
4675.00%
Myanmar
92
180
95.70%
United States
170
173
1.80%
Paraguay
77
153
98.70%
Rwanda
0
146
N/A
Nepal
7
111
1485.70%
Iran
144
108
−25.0%
Tanzania
5
104
1980.00%
Russian Federation
176
100
−43.2%
Egypt
87
87
0.00%
Thailand
64
86
34.40%
United Kingdom
121
84
−30.6%
Iraq
23
80
247.80%
Morocco
55
61
10.90%
Zimbabwe
0
53
N/A
Malaysia
35
45
28.60%
Syria
57
35
−38.6%
Ethiopia
7
34
385.70%
Saudi Arabia
30
34
13.30%
Uzbekistan
21
34
61.90%
Kazakhstan
28
32
14.30%
Papua New Guinea
2
30
1400.00%
Uruguay
31
30
−3.2%
Germany
33
27
−18.2%
Cameroon
5
23
360.00%
Algeria
13
21
61.50%
Chile
27
21
−22.2%
Yemen
0
20
N/A
Libya
13
18
38.50%
Mauritania
11
17
54.50%
South Africa
23
17
−26.1%
Afghanistan
66
16
−75.8%
Canada
16
15
−6.2%
Azerbaijan
2
14
600.00%
France
18
14
−22.2%
Poland
37
14
−62.2%
Laos
4
12
200.00%
Ukraine
22
12
−45.5%
Australia
13
11
−15.4%
Ecuador
1
10
900.00%
Kyrgyzstan
4
10
150.00%
Senegal
7
10
42.90%
Ireland
10
8
−20.0%
Spain
4
8
100.00%
Italy
8
7
−12.5%
Mauritius
1
7
600.00%
Niger
6
7
16.70%
Philippines
1
7
600.00%
Burkina Faso
3
6
100.00%
Nigeria
4
6
50.00%
Tunisia
10
6
−40.0%
Denmark
2
5
150.00%
Guinea
5
5
0.00%
Jordan
5
5
0.00%
Portugal
2
5
150.00%
Sierra Leone
0
5
N/A
Tajikistan
6
5
−16.7%
United Arab Emirates
5
5
0.00%
World total
11,476
33,091
188.30%
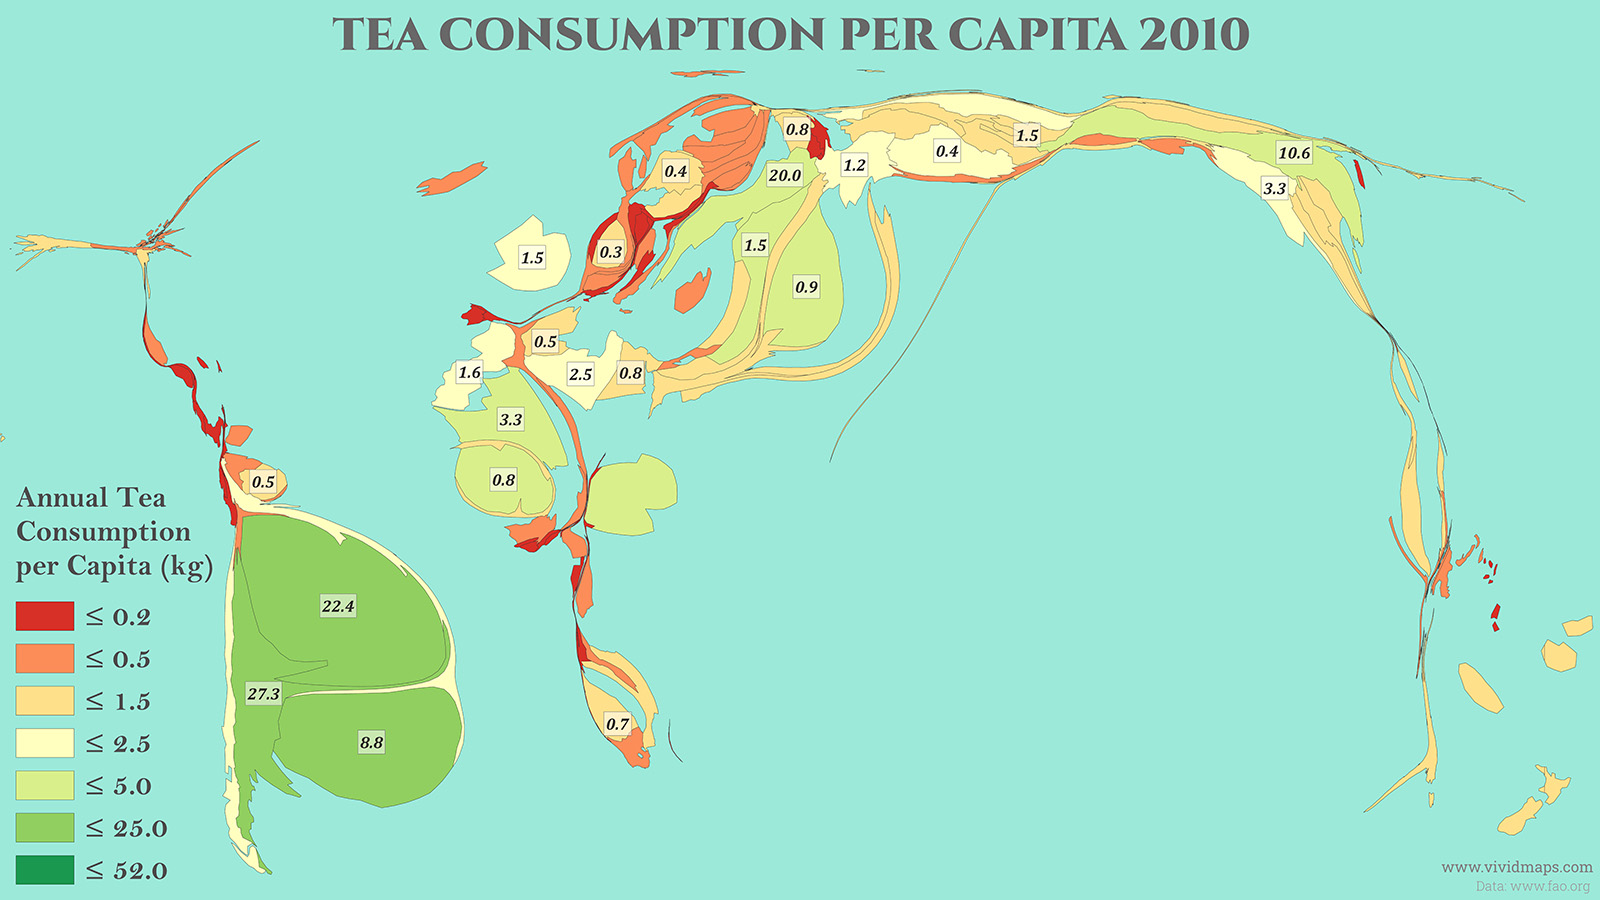
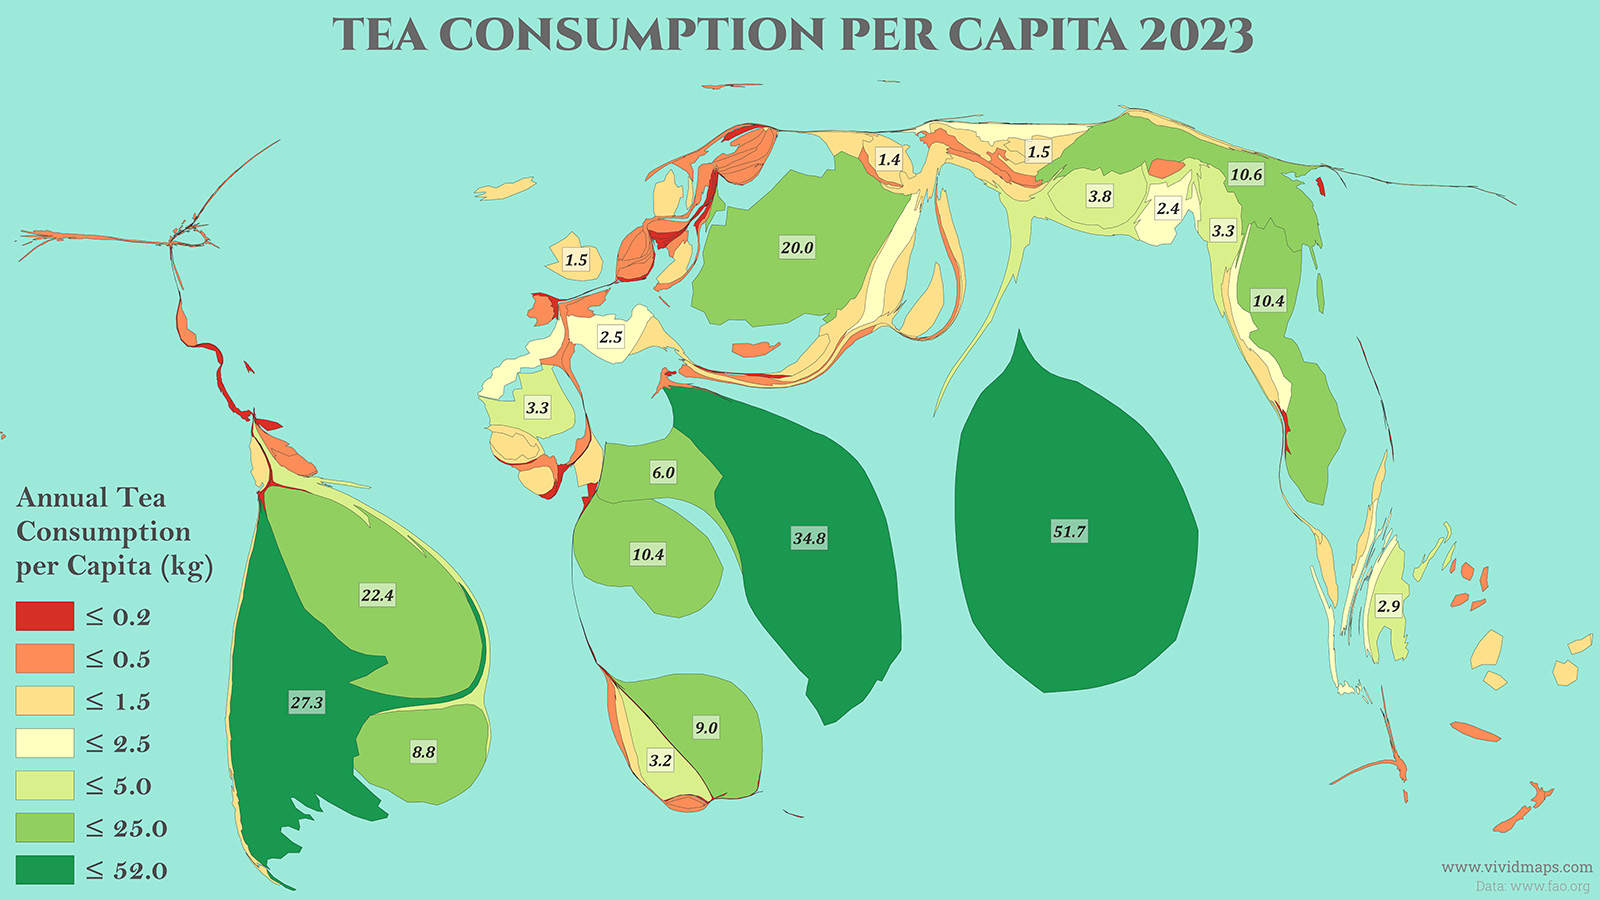
Tea Consumption by Country (Cartograms): 2010 vs 2023
Per Capita Consumption
Total volume favors big populations. Measured per person, the ranking changes completely. Sri Lanka supplies more tea per resident than any other country on record, 51.69 kg (114.0 lbs) in 2023, down from 69.12 kg (152.4 lbs) in 2010. That figure reflects apparent national supply rather than a precise average of individual drinking. Turkiye’s per capita number rose from 2.82 kg (6.2 lbs) to 19.98 kg (44.0 lbs) over the same period. Vietnam moved from 0.72 kg (1.6 lbs) to 10.41 kg (23.0 lbs). Argentina and Paraguay both rank high on the per capita table, at 27.26 kg (60.1 lbs) and 22.35 kg (49.3 lbs), though that reflects yerba mate rather than Camellia sinensis. Ireland and the United Kingdom moved the other direction, both settling under 1.5 kg per person as coffee culture and specialty coffee shops took a growing share of daily habits, with a 2023 consumer survey finding more Britons now drink coffee regularly than tea.
Annual Tea and Mate Supply Per Capita (kg per person per year)
Country
2010 (kg/cap)
2023 (kg/cap)
Change
Sri Lanka
69.12
51.69
−25.2%
Kenya
0.33
34.78
10439.40%
Argentina
5.6
27.26
386.80%
Paraguay
13.5
22.35
65.60%
Türkiye
2.82
19.98
608.50%
China
4.6
10.63
131.10%
Rwanda
0
10.45
N/A
Vietnam
0.72
10.41
1345.80%
Malawi
0.24
9.03
3662.50%
Uruguay
9.39
8.84
−5.9%
Uganda
0
6
N/A
Mauritius
1.09
5.19
376.10%
India
0.61
4.01
557.40%
Nepal
0.27
3.75
1288.90%
Myanmar
1.87
3.32
77.50%
Brazil
2.11
3.31
56.90%
Mauritania
3.12
3.3
5.80%
Zimbabwe
0
3.25
N/A
Papua New Guinea
0.3
2.9
866.70%
Libya
1.98
2.45
23.70%
Bangladesh
0.35
2.37
577.10%
Indonesia
0.31
2.1
577.40%
Iraq
0.88
2.07
135.20%
Barbados
0.88
1.9
115.90%
Maldives
0.84
1.89
125.00%
Morocco
1.7
1.62
−4.7%
Laos
0.57
1.61
182.50%
Kazakhstan
1.68
1.58
−6.0%
Tanzania
0.1
1.55
1450.00%
Syria
2.51
1.5
−40.2%
Kyrgyzstan
0.66
1.47
122.70%
Ireland
2.18
1.46
−33.0%
Azerbaijan
0.19
1.39
631.60%
Malaysia
1.22
1.28
4.90%
Antigua and Barbuda
0.77
1.25
62.30%
Qatar
0
1.24
N/A
United Kingdom
1.92
1.23
−35.9%
Thailand
0.93
1.2
29.00%
Iran
1.86
1.19
−36.0%
Malta
1.98
1.07
−46.0%
Chile
1.57
1.05
−33.1%
Saudi Arabia
1.2
1.01
−15.8%
Bahrain
0
0.96
N/A
Pakistan
0.46
0.95
106.50%
Uzbekistan
0.74
0.95
28.40%
Kuwait
4.13
0.92
−77.7%
Denmark
0.33
0.9
172.70%
Seychelles
0.96
0.88
−8.3%
Vanuatu
0.06
0.87
1350.00%
Oman
1.32
0.84
−36.4%
Tuvalu
0
0.83
N/A
Cameroon
0.26
0.81
211.50%
Georgia
0.54
0.78
44.40%
Egypt
0.97
0.76
−21.6%
Gambia
2.82
0.76
−73.0%
Botswana
0.93
0.7
−24.7%
Russian Federation
1.23
0.69
−43.9%
Fiji
0.65
0.63
−3.1%
Lebanon
0.77
0.63
−18.2%
Sierra Leone
0.04
0.63
1475.00%
Albania
0.15
0.62
313.30%
Bahamas
0.97
0.62
−36.1%
Eswatini
0.56
0.6
7.10%
Iceland
0.48
0.56
16.70%
Marshall Islands
0
0.56
N/A
Ecuador
0.06
0.55
816.70%
Grenada
0.07
0.55
685.70%
Senegal
0.56
0.55
−1.8%
Mongolia
1.03
0.51
−50.5%
Tunisia
0.94
0.5
−46.8%
United States
0.55
0.5
−9.1%
Yemen
0
0.5
N/A
[Place pair of cartograms here, annual tea consumption per capita in kg, 2010 vs 2023]
Tea Consumption per capita (Cartograms): 2010 vs 2023
Rising incomes across Asia drove most of the genuine growth. China’s own green tea output is on track to more than double by 2027, from 1.5 million tonnes in 2015 to 2017 up to a projected 3.3 million tonnes. Turkiye’s tea culture is largely self-contained. Roughly 95 percent of what its Rize province farmers grow stays inside the country, absorbed by a domestic market that depends very little on imports. The declines cluster around a different set of forces. Conflict disrupted Syria and Afghanistan. Sanctions and war cut into Russian trade after 2022. Decades of shifting taste pulled the United Kingdom and Ireland toward coffee, matcha, and specialty drinks instead of the ordinary tea bag.