Countries with Regular Annual Snowfall Mapped
Snow in Kenya? Australia? South Africa? This elevation-based world map shows exactly where regular snowfall happens around the world.
Read More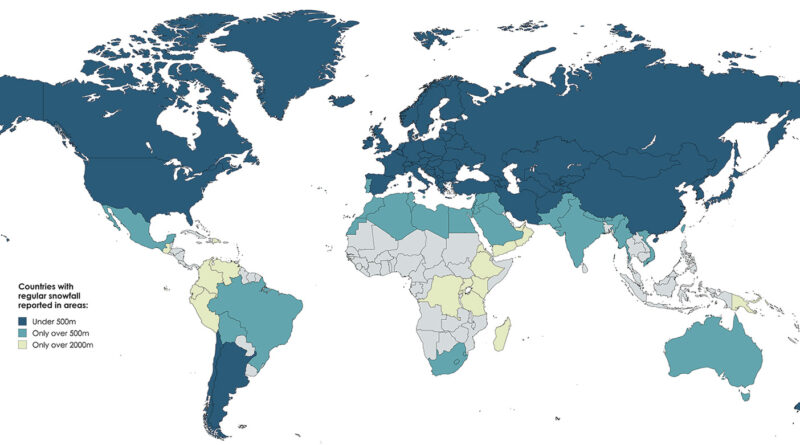
Snow in Kenya? Australia? South Africa? This elevation-based world map shows exactly where regular snowfall happens around the world.
Read More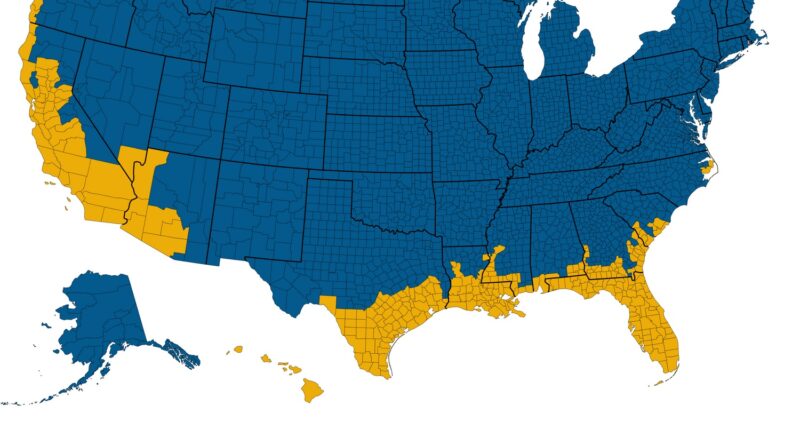
Most of the United States gets colder in winter than Victoria, British Columbia. This temperature comparison map shows exactly which American regions stay warmer than Canada’s mildest city.
Read More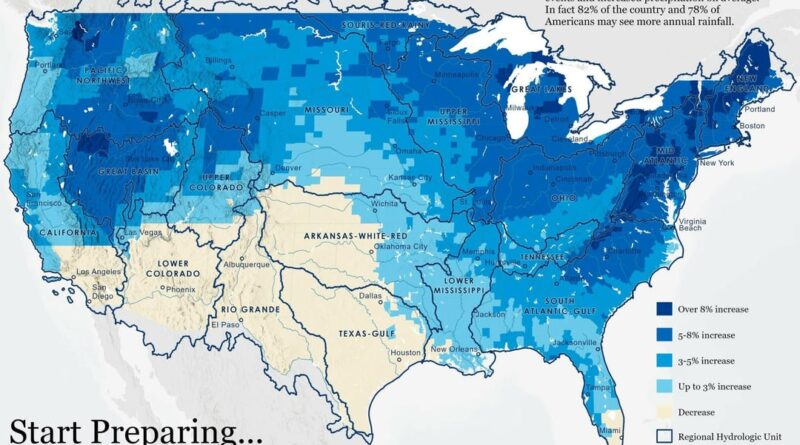
Two climate projection maps show exactly where America’s rainfall patterns will change by mid-century. Most regions will get wetter, but some will get drier, and certain areas face storms that dump enormous amounts of water in dangerously short periods.
Read More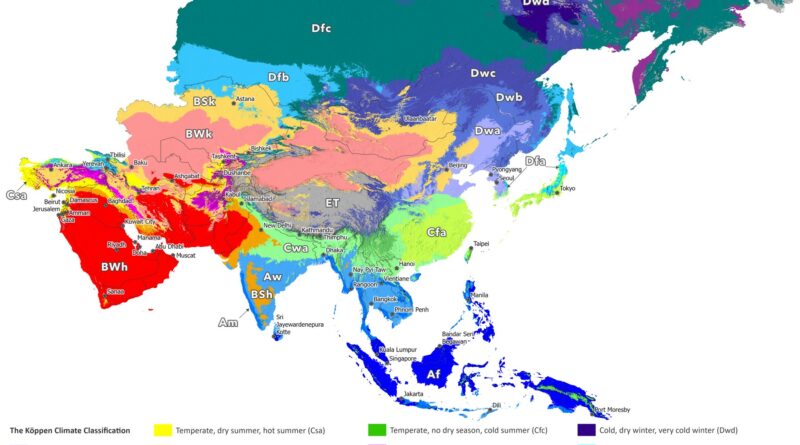
Köppen-Geiger climate maps of Asia reveal major reorganization from 1930 to 2099. Arctic tundra retreats along Siberian coast, subarctic zones contract, subtropical expands north in China, Himalayan and Tibetan cold zones shrink, and desert boundaries shift under ssp2-4.5 scenario.
Read More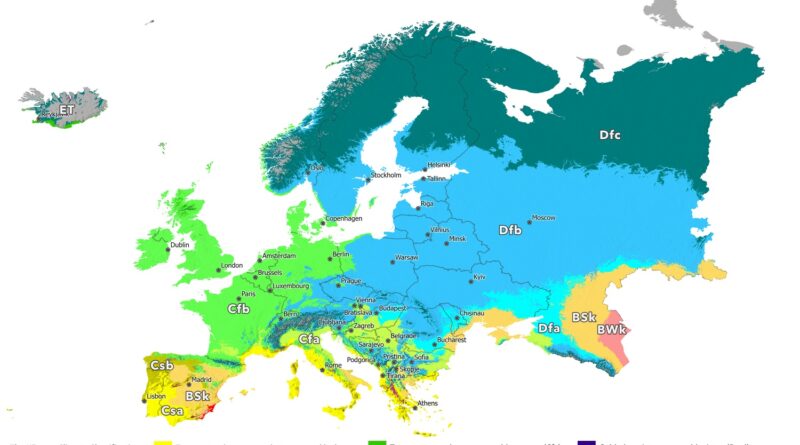
Köppen-Geiger climate maps of Europe reveal zones migrating hundreds of kilometers north from 1930 to 2099. Mediterranean climate expands into France and interior Iberia, subarctic retreats in Scandinavia, continental shifts northeast, and Alpine tundra vanishes from lower peaks under ssp2-4.5 scenario.
Read More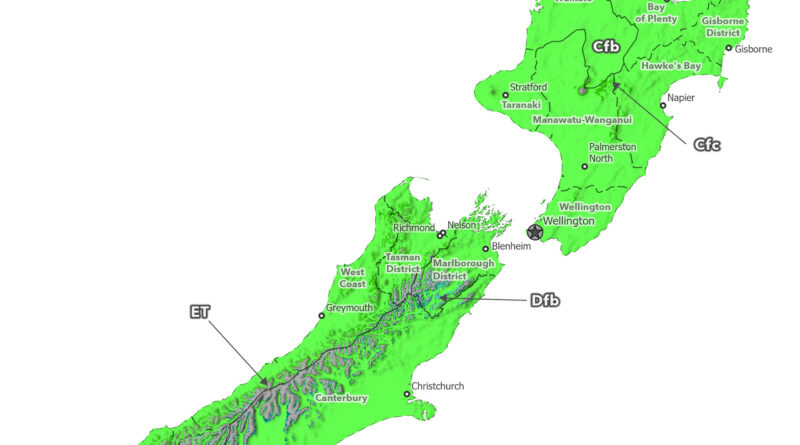
Köppen-Geiger climate maps of New Zealand reveal mountain climate zones disappearing from 1930 to 2099. Cool-summer oceanic climate (Cfc) vanishes from North Island, tundra patches (ET) disappear from Southern Alps peaks, subarctic zones (Dfc) shrink dramatically, and cold steppe (BSk) contracts under ssp2-4.5 scenario.
Read More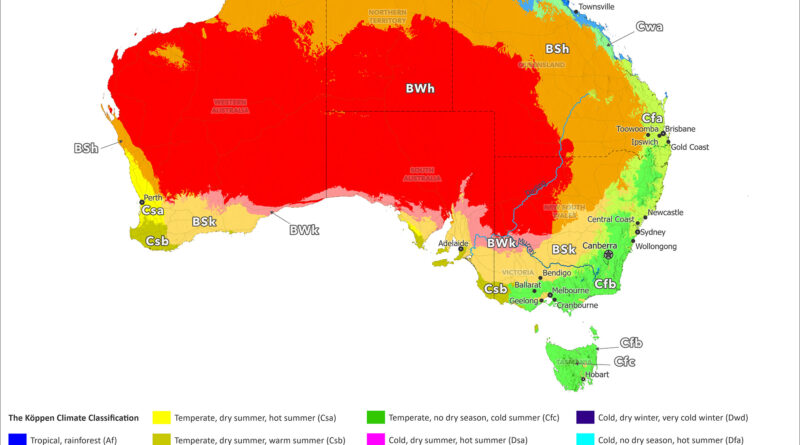
Köppen-Geiger climate maps of Australia reveal desert expansion from 1930 to 2099. Hot desert (BWh) and steppe (Bsh) zones spread hundreds of kilometers toward Sydney, Brisbane, Melbourne, and Perth. Habitable climate zones supporting population centers get compressed coastward under ssp2-4.5 scenario.
Read More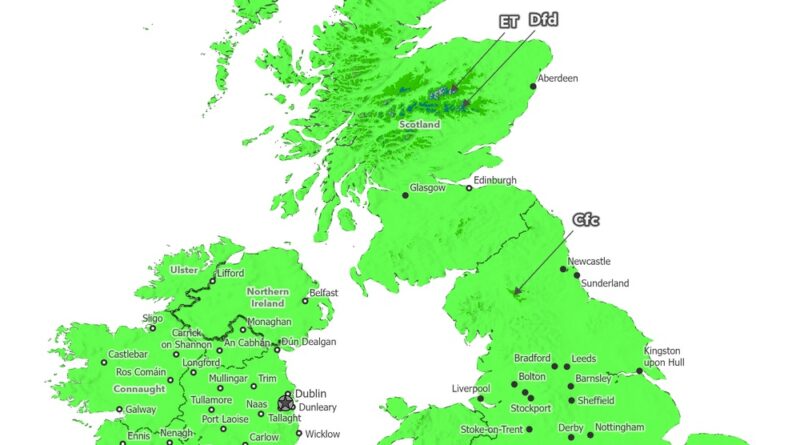
Köppen-Geiger climate maps of the British Isles reveal mountain climate zones disappearing from 1930 to 2099. Tundra patches in the Grampians vanish by the 2070s, extreme cold zones disappear by the 2090s, and the Pennines lose their cool-summer classification entirely under the ssp2-4.5 scenario.
Read More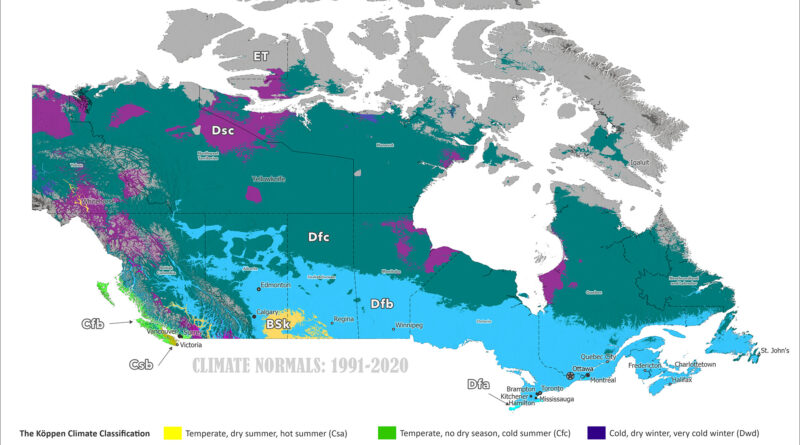
Köppen-Geiger climate maps of Canada reveal dramatic northward shifts from 1901-1930 to 2077-2099. Animated comparisons show tundra retreating to Arctic islands, subarctic zones moving hundreds of kilometers north, tree line advancing, and southern continental climates warming under the ssp2-4.5 scenario.
Read More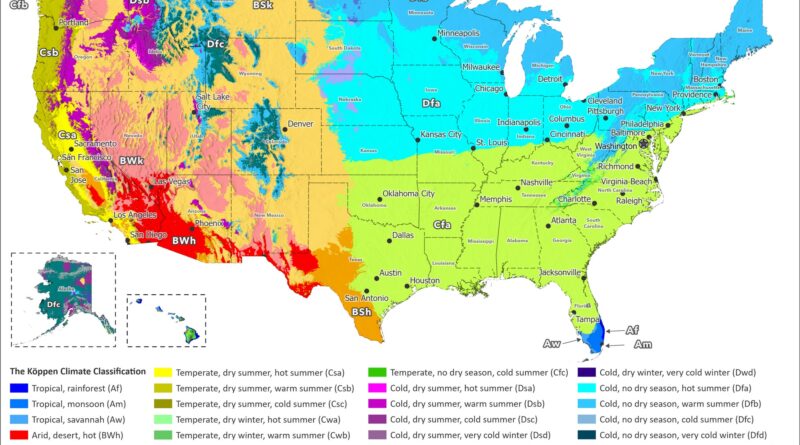
New Köppen-Geiger climate maps of the United States reveal dramatic shifts from 1901-1930 to 2077-2099. Watch animated comparisons showing how tundra retreats in Alaska, continental zones move north, and arid regions expand in the West under the ssp2-4.5 climate scenario.
Read More