Climate
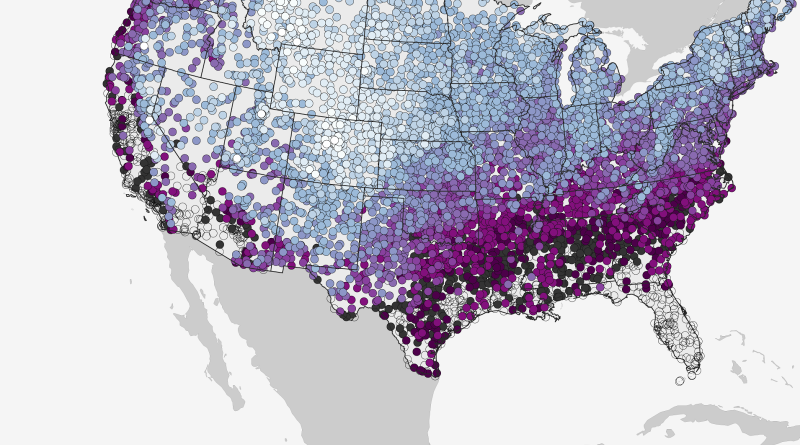
When does the climate record say you can expect the season’s first snow?
This map shows the historic date by which there’s a 50% chance of at least 0.1” of snow on the
Read MoreClimate zones of the U. S. (International Energy Conservation Code)
This map is the climate map used by folks installing heating and air conditioning, to best estimate cooling and heating
Read More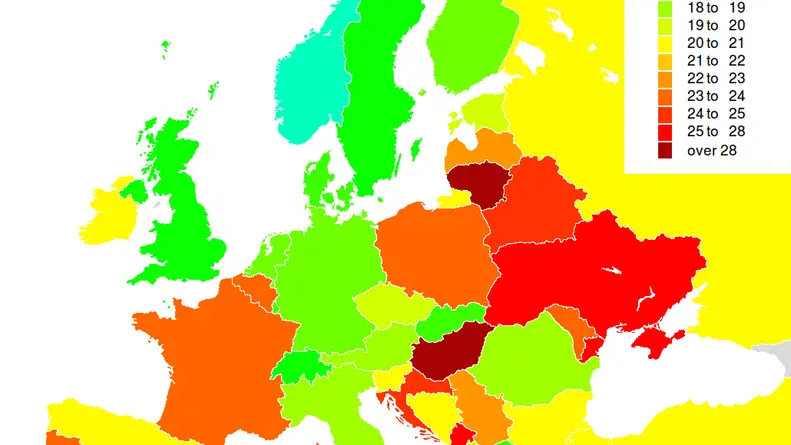
Sum of average temperatures & suicides in Europe
The relationship of average temperatures and suicides in Europe. Suicide rates in Europe Related post: – Suicide death rates
Read More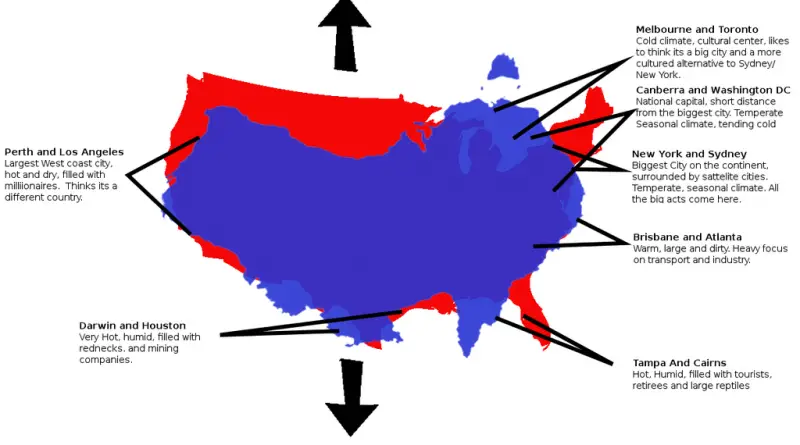
Australia vs U.S. with Australia flipped upside down
Melbourne and Toronto Cold climate, cultural center, likes to think its a big city and a more cultured alternative to
Read MoreClimate maps
Climatemaps is an interactive map of global monthly mean climate data from land observations between 1961 and 1990. Temperature Precipitation
Read MoreVisualizing Toronto parking fines
Within the Downtown and East York regions of Toronto, during 2015 enforcement officers issued over $68.6 million in parking fines
Read More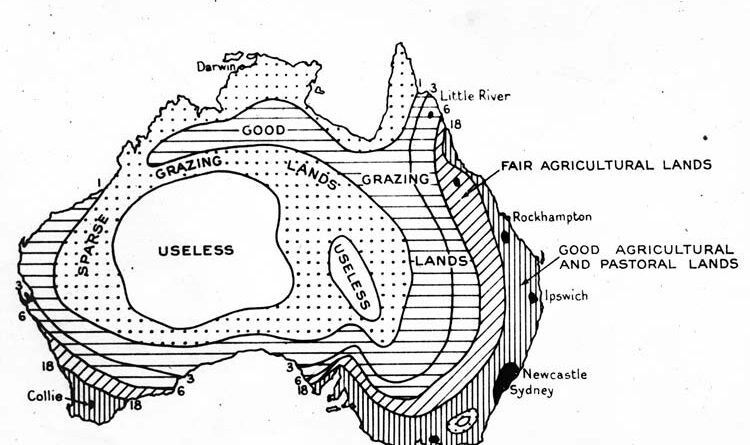
Australia’s 1946 Habitability Map
Australia’s climate has always posed challenges – from the arid interior that baffled settlers to today’s rising heat and shifting rainfall.
Read MoreIncrease in total heatwave days by state
Via climate.gov & ecoclimax.com Relates post: – Heat Wave Days by US Contiguous County (1981-2010)
Read More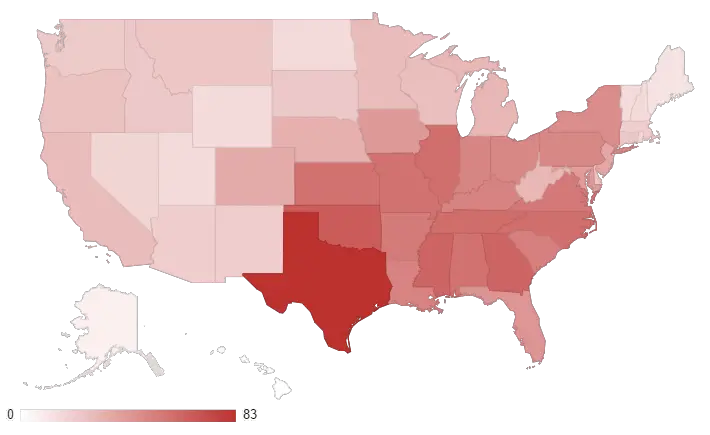
Billion-dollar weather & climate disasters by state (1980 – 2016)
The map below reflects a summation of billion-dollar events for each state affected. From 1980–2016, there have been 23 drought
Read More