Population
50 biggest U.S. cities ranked by the geographic diversity of their populations
According to seattletimes.com Among the 50 biggest U.S. cities, Seattle ranks No. 3 on the “geographic diversity index” with a
Read More
Mapping land use scenarios
The Integrated Climate and Land use Scenarios (ICLUS) outputs are derived from a pair of models. A demographic model generates
Read More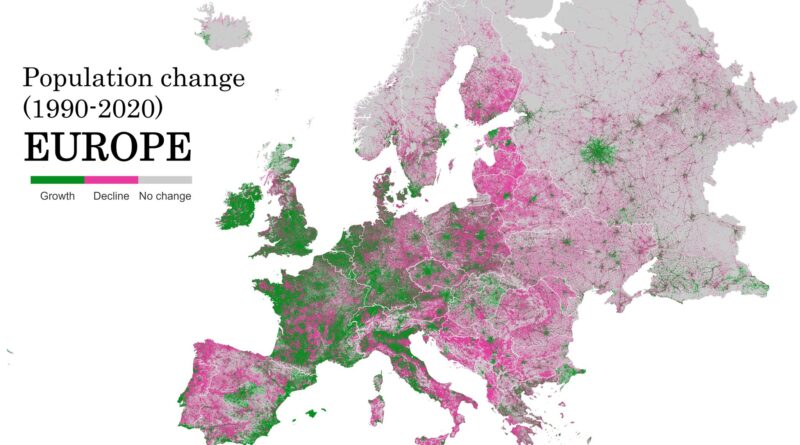
Europe’s Shifting Population: Growth, Decline, and Migration Trends
Europe’s population has undergone dramatic shifts in recent decades. While Western Europe experiences steady growth fueled by immigration, Eastern European countries face significant declines due to emigration and low birth rates. Explore two insightful maps that reveal the forces shaping Europe’s demographic future.
Read MoreFlorida Dis-United: The Ten Distinct States That Make Up Florida
Florida has a reputation as America’s weirdest state, but there’s hardly any national appreciation for the fact that Florida has
Read MoreRefugees & migrants stranded in Greece
Via theatlantic.com
Read MoreA year of population change
Percent change in U.S. resident population 2014 – 2015. Via washingtonpost.com Related posts: – U.S. Population under 5 years of
Read More9 States fit into Los Angeles county by population
U.S. States with a smaller population than Los Angeles County
Read More