GDP growth by country (2016)
Reddit user: MIA-in-MIA
Read More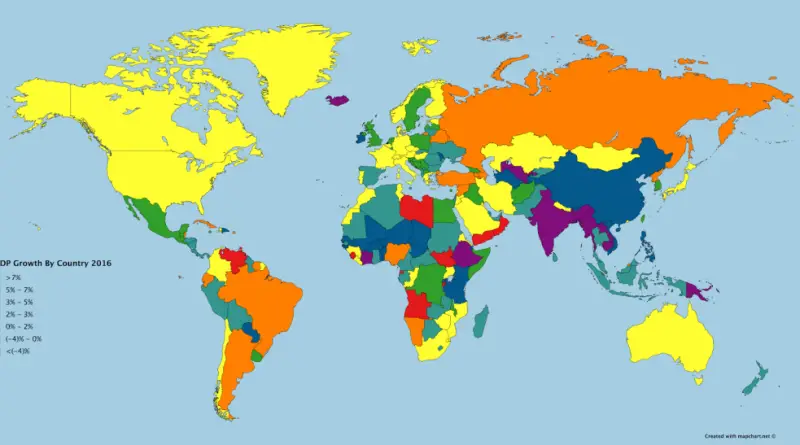
Reddit user: MIA-in-MIA
Read MoreRelated posts: – 6 maps that show the anatomy of America’s infrastructure – Distance from crude oil pipelines by Zip
Read MoreWhat in your state the worst at? Source: pleated-jeans.com Related post: – The United States of awesome
Read MoreReddit user: AJgloe
Read MoreWheat is the leading source of vegetal protein in human food, having a protein content of about 13%, which is
Read MoreA fuel is any material that can be made to react with other substances so that it releases chemical or
Read More
Via washingtonpost.com
Read More
Youtube version Drought duration in the U.S., 2010 Drought duration in the U.S., 2011 Drought duration in the U.S., 2012
Read More