I’ve spent years drawing maps and staring at political boundaries, always wondering: what if we threw out those arbitrary lines and started over? What if, instead of following the legacy of colonial empires and ancient wars, our borders traced something more fundamental—the flow of water itself?
That question led me to create a series of world maps that reimagine our planet not as a collection of nations, but as a collection of river basins. Each “country” follows the natural watershed of a major river system. It’s a cartographic thought experiment, but it also shows how we might better manage our shared resources.
This natural division of land has been crucial to human civilization since its inception. They’ve given us irrigation for crops, highways for commerce, and the water we need for everything from drinking to manufacturing. Each basin has its own personality—its own climate patterns, ecological characteristics, and responses to seasonal changes.
So what if we actually organized ourselves around these natural units? Several advantages become clear:
Water Management: Right now, water crosses borders without asking permission. A river doesn’t recognize when it leaves one country and enters another. Managing an entire watershed as a single unit could eliminate many of the inefficiencies and inequities we see today.
Environmental Protection: Ecosystems rarely fit neatly inside political boundaries. A basin-wide approach could make conservation efforts work as integrated systems rather than fragmented pieces.
Disaster Response: When floods hit or droughts settle in, they affect entire watersheds. Coordinating responses across a whole basin rather than trying to patch together efforts from multiple competing jurisdictions would be more effective.
Tailored Development: Every basin is different. Some are arid, others tropical. Some drain mountains, others meander across plains. Development strategies that recognize these differences could be more sustainable and effective.
Water Conflicts: A lot of international disputes boil down to who gets the water. Basin-based boundaries might not eliminate these conflicts, but they could reframe them in more productive ways.
With all this in mind, I set out to see what the world might actually look like if we redrew the map along watershed lines.
Reimagining Countries as Watersheds
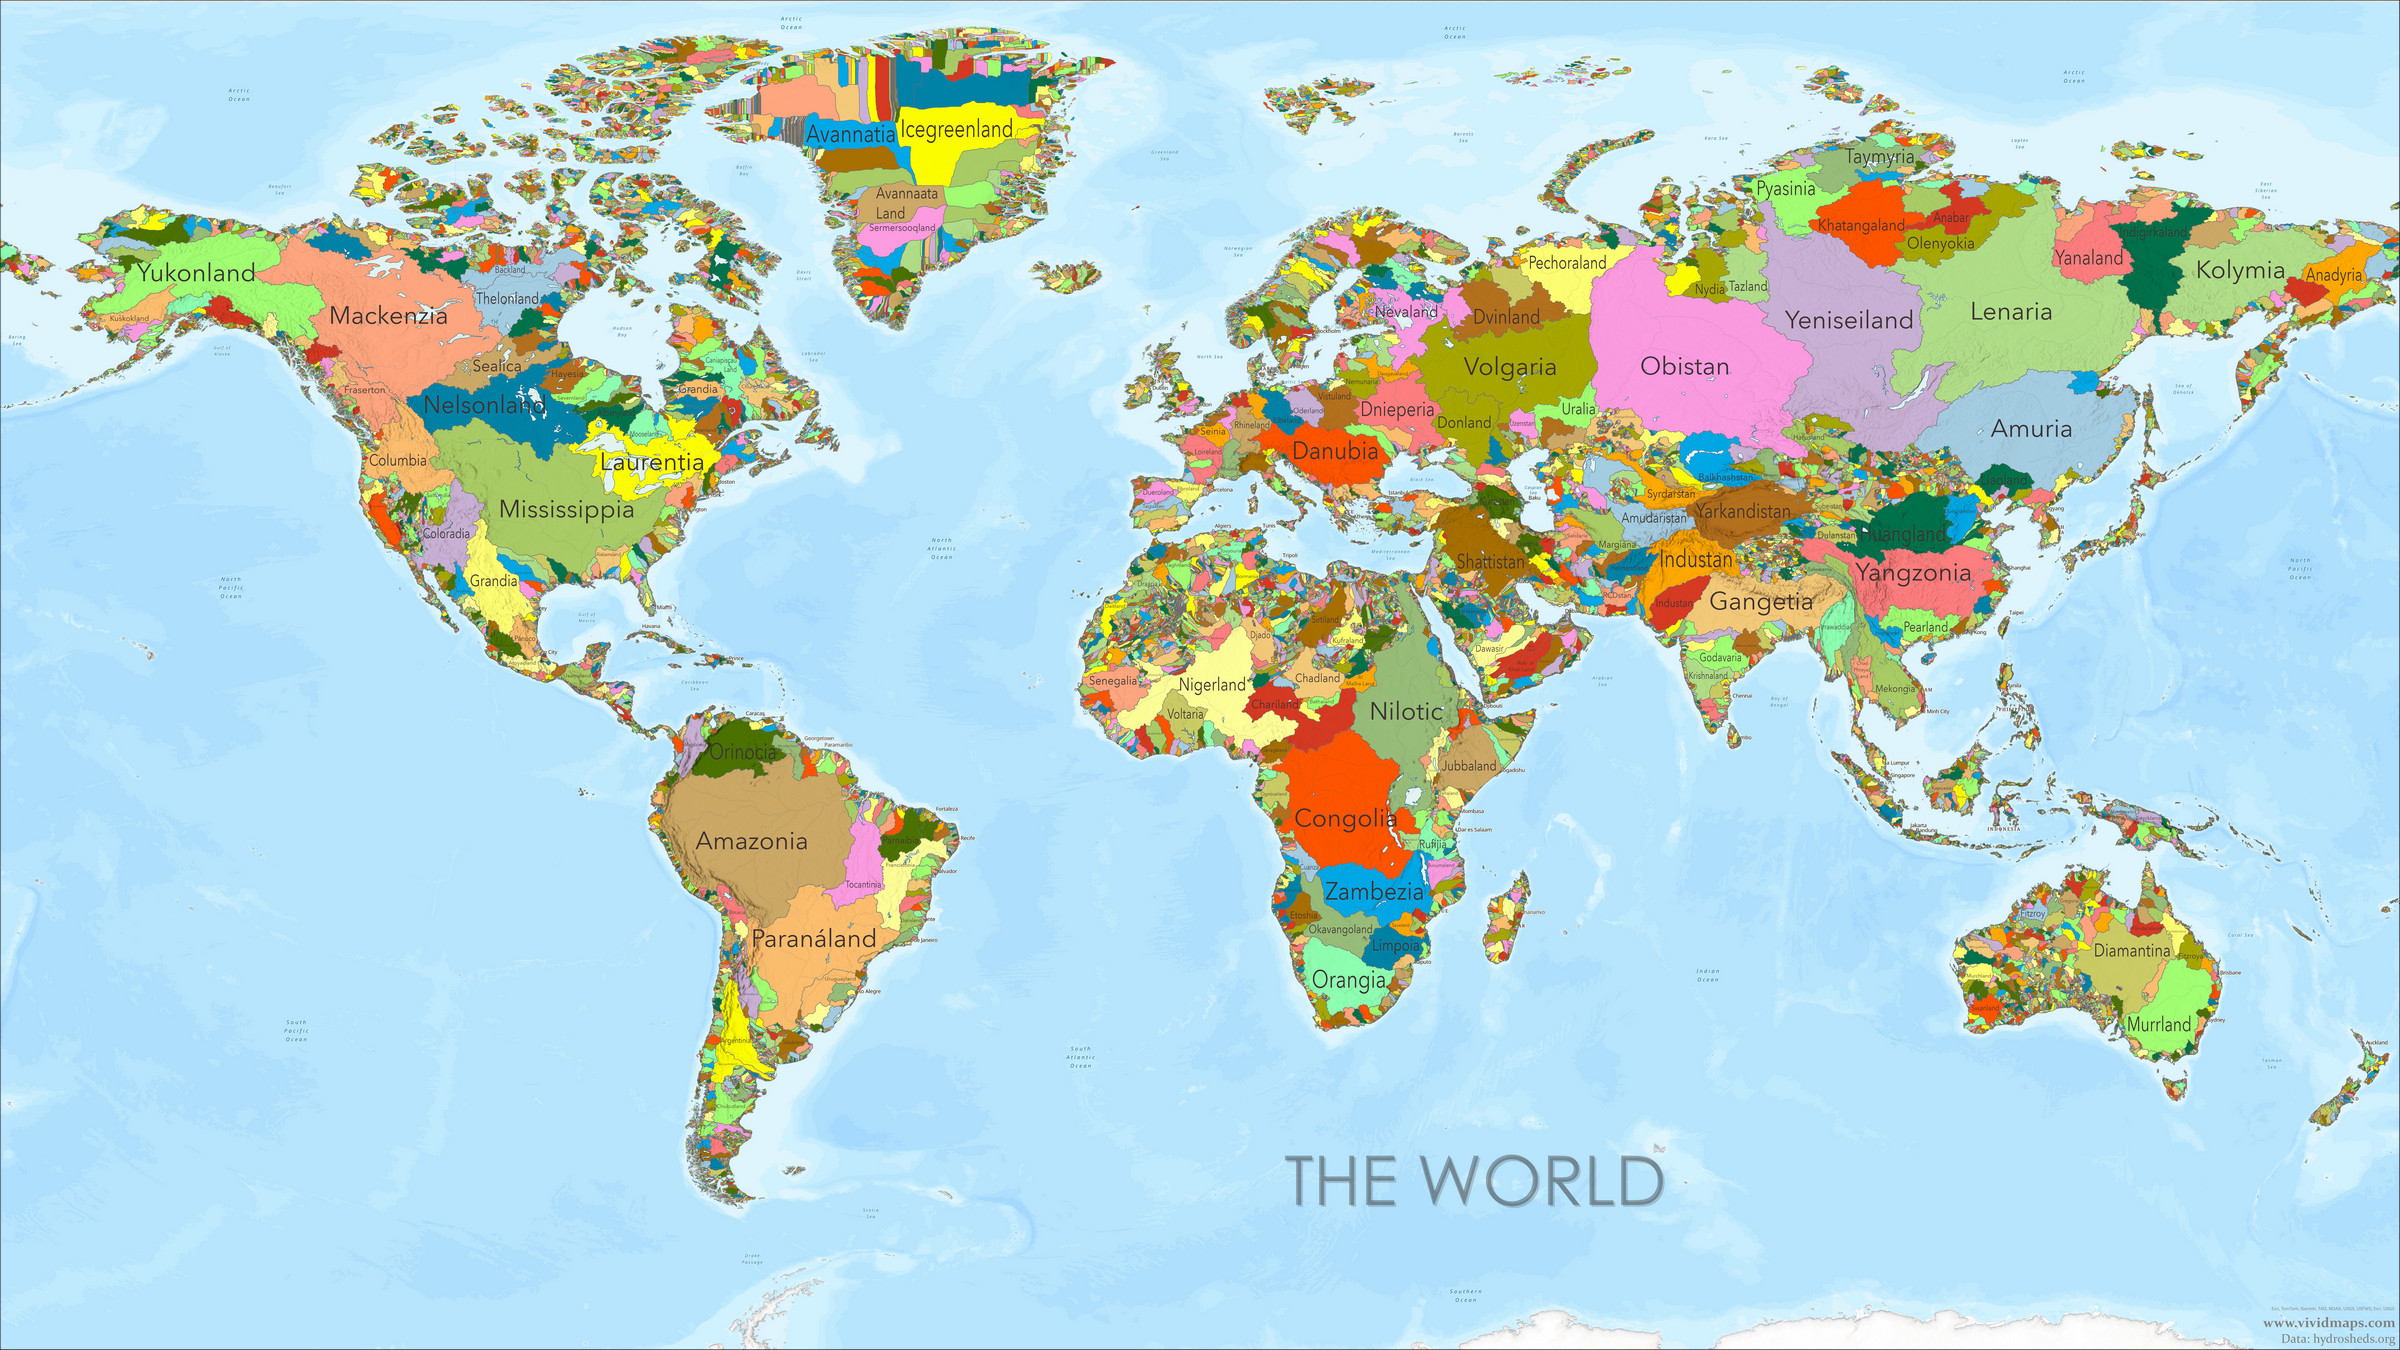
The first map I created shows the world divided into “nations” defined by major river basins. I used watershed data from the HydroSHEDS project—a massive undertaking by WWF that began back in 2006 to create free, high-resolution hydrological data for the entire planet.
World map of river basins by area. The largest basins are highlighted. [Click here for a high-resolution version]
The map looks alien. Familiar continents suddenly fragment into unfamiliar shapes. In this alternate world, countries bear the names of their dominant rivers:
Amazonia (Amazon River)
Congolia (Congo River)
Mississippia (Mississippi River)
Obistan (Ob River)
Nilotic (Nile River)
Paranáland (Paraná River)
Yeniseiland (Yenisei River)
Lenaria (Lena River)
Amuria (Amur River)
Nigerland (Niger River)
Looking at the world this way highlights something we often forget: the planet organizes itself through water flow, and within each basin, everything connects.
The World’s Largest Basin Countries
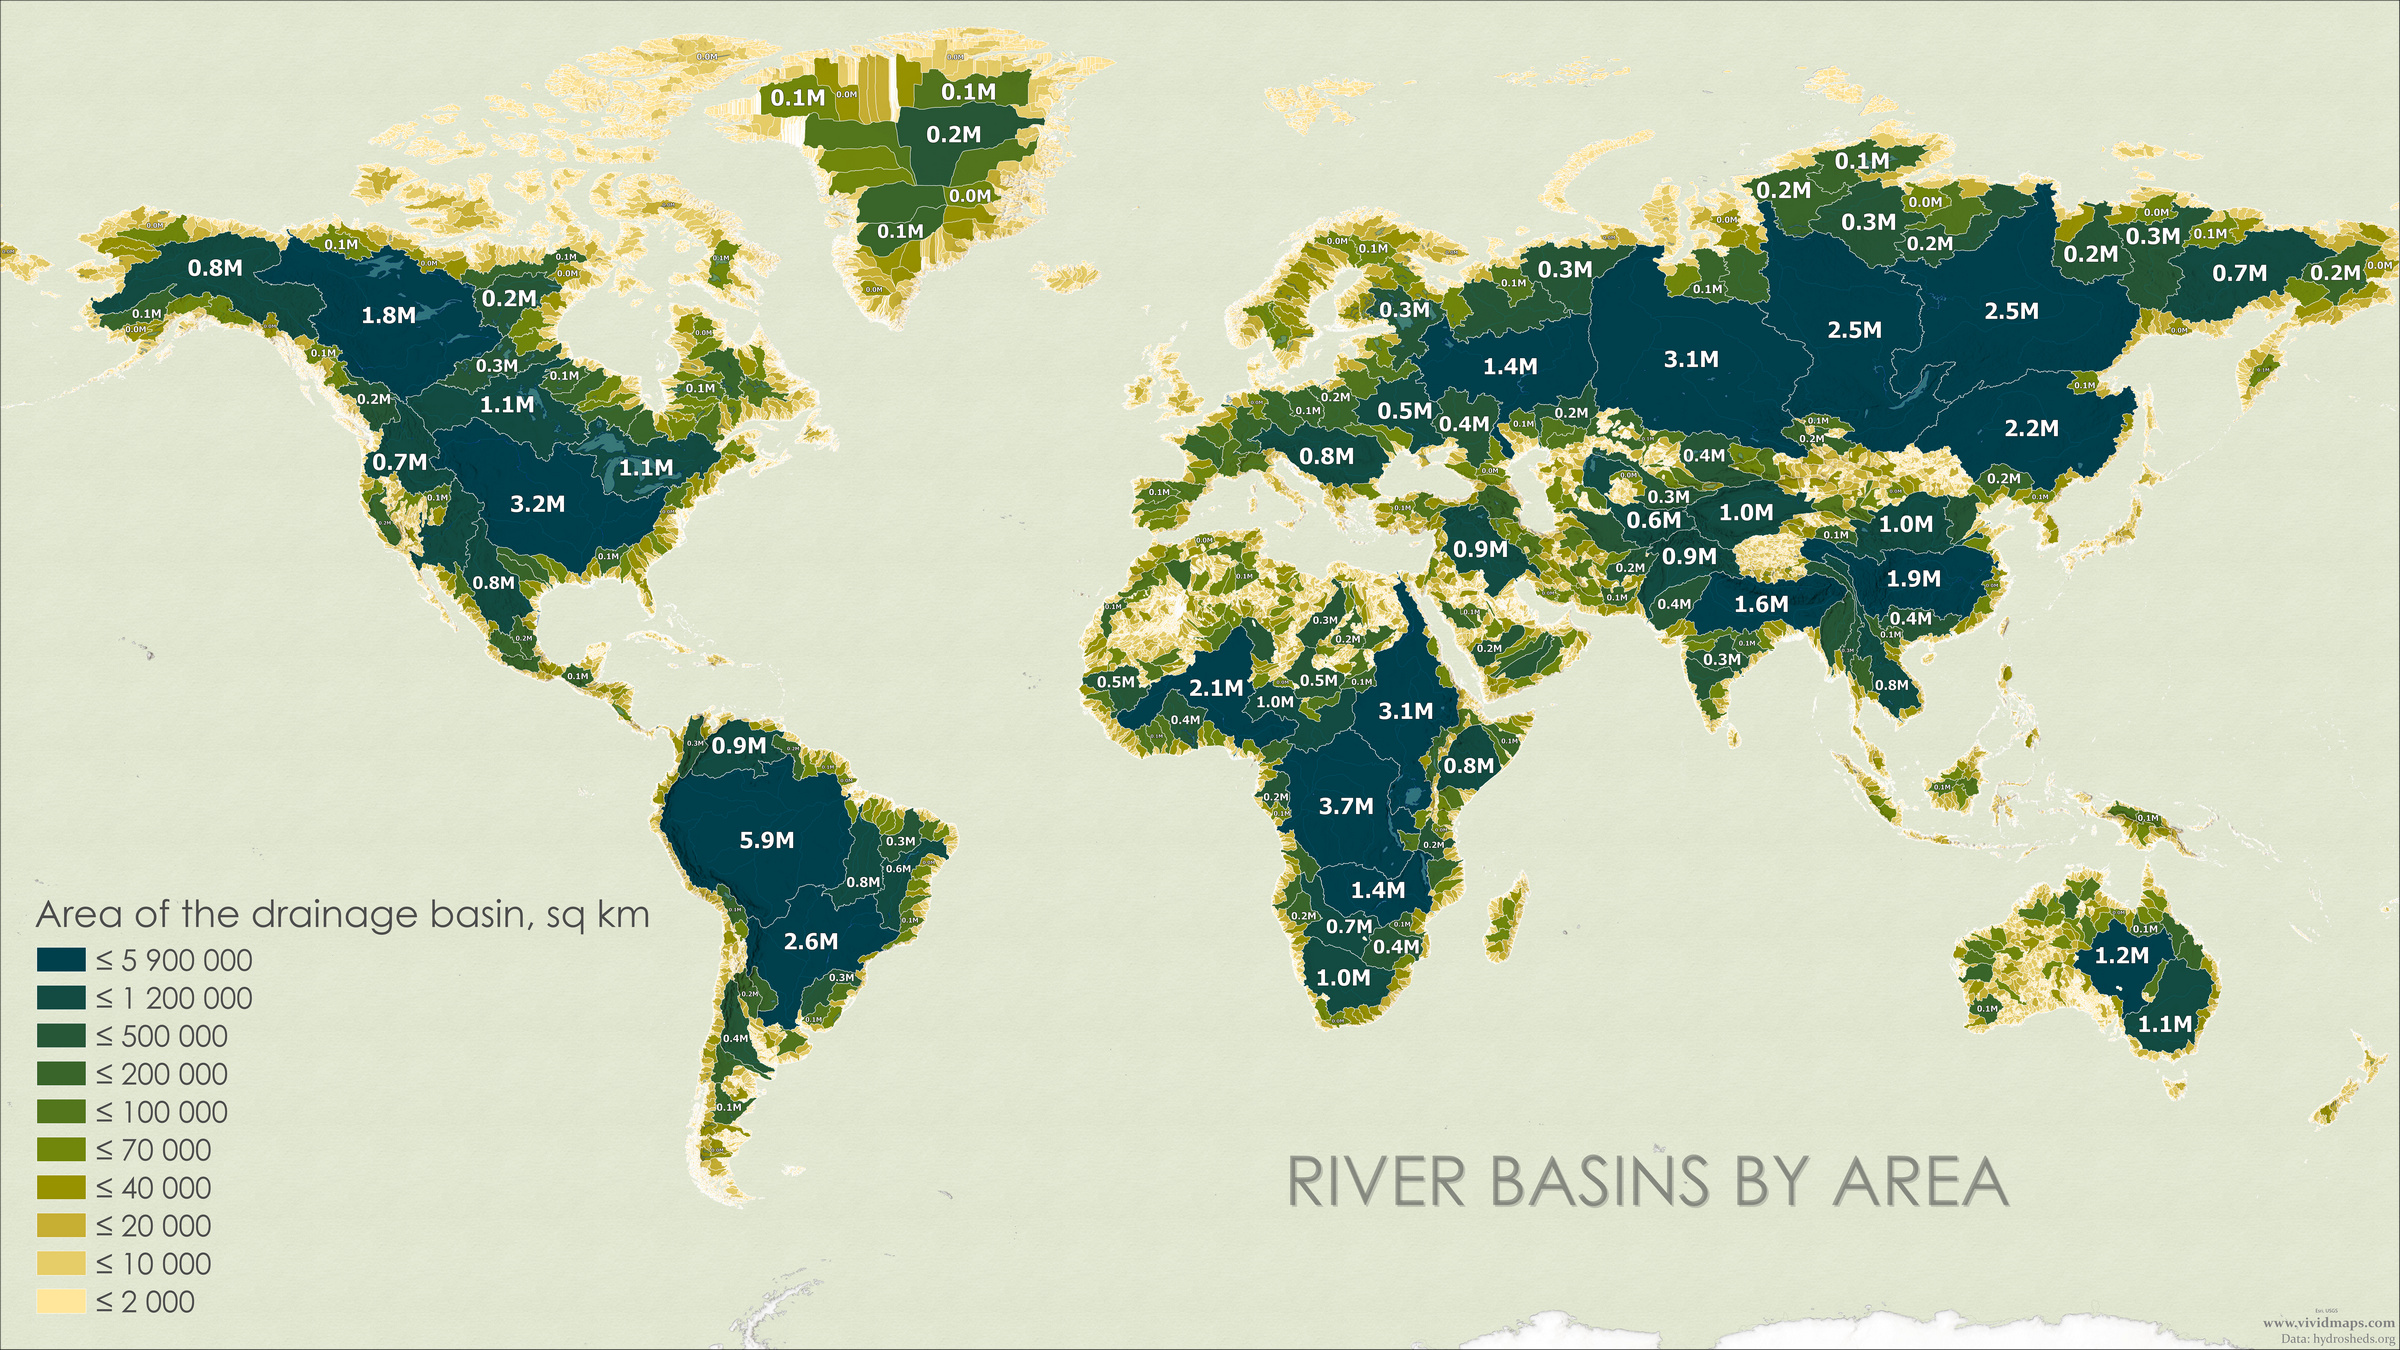
World map of river basins by area [Click here for a high-resolution version]
Curious about which “countries” would dominate this watershed world, I calculated basin areas using ArcGIS’s Calculate Geometry tool with a Miller Cylindrical projection.
According to my calculations, the ten largest countries in our river basin world would be:
Country Name
Area (km²)
Area (sq mi)
Current Basin Name
Amazonia
5,888,270
2,273,470
Amazon
Congolia
3,705,240
1,430,600
Congo
Mississippia
3,240,630
1,251,210
Mississippi
Obistan
3,088,720
1,192,560
Ob
Nilotic
3,057,780
1,180,610
Nile
Paranáland
2,646,310
1,021,740
Paraná
Yeniseiland
2,505,680
967,450
Yenisei
Lenaria
2,453,660
947,360
Lena
Amuria
2,238,980
864,470
Amur
Nigerland
2,123,000
819,690
Niger
This table showcases the vast territories these river systems encompass, often spanning multiple countries in our current geopolitical landscape.
Climate Characteristics of Basin Countries
To further explore the nature of these basin-defined nations, I created two additional world map posters focusing on climatic conditions.
Temperature Distribution
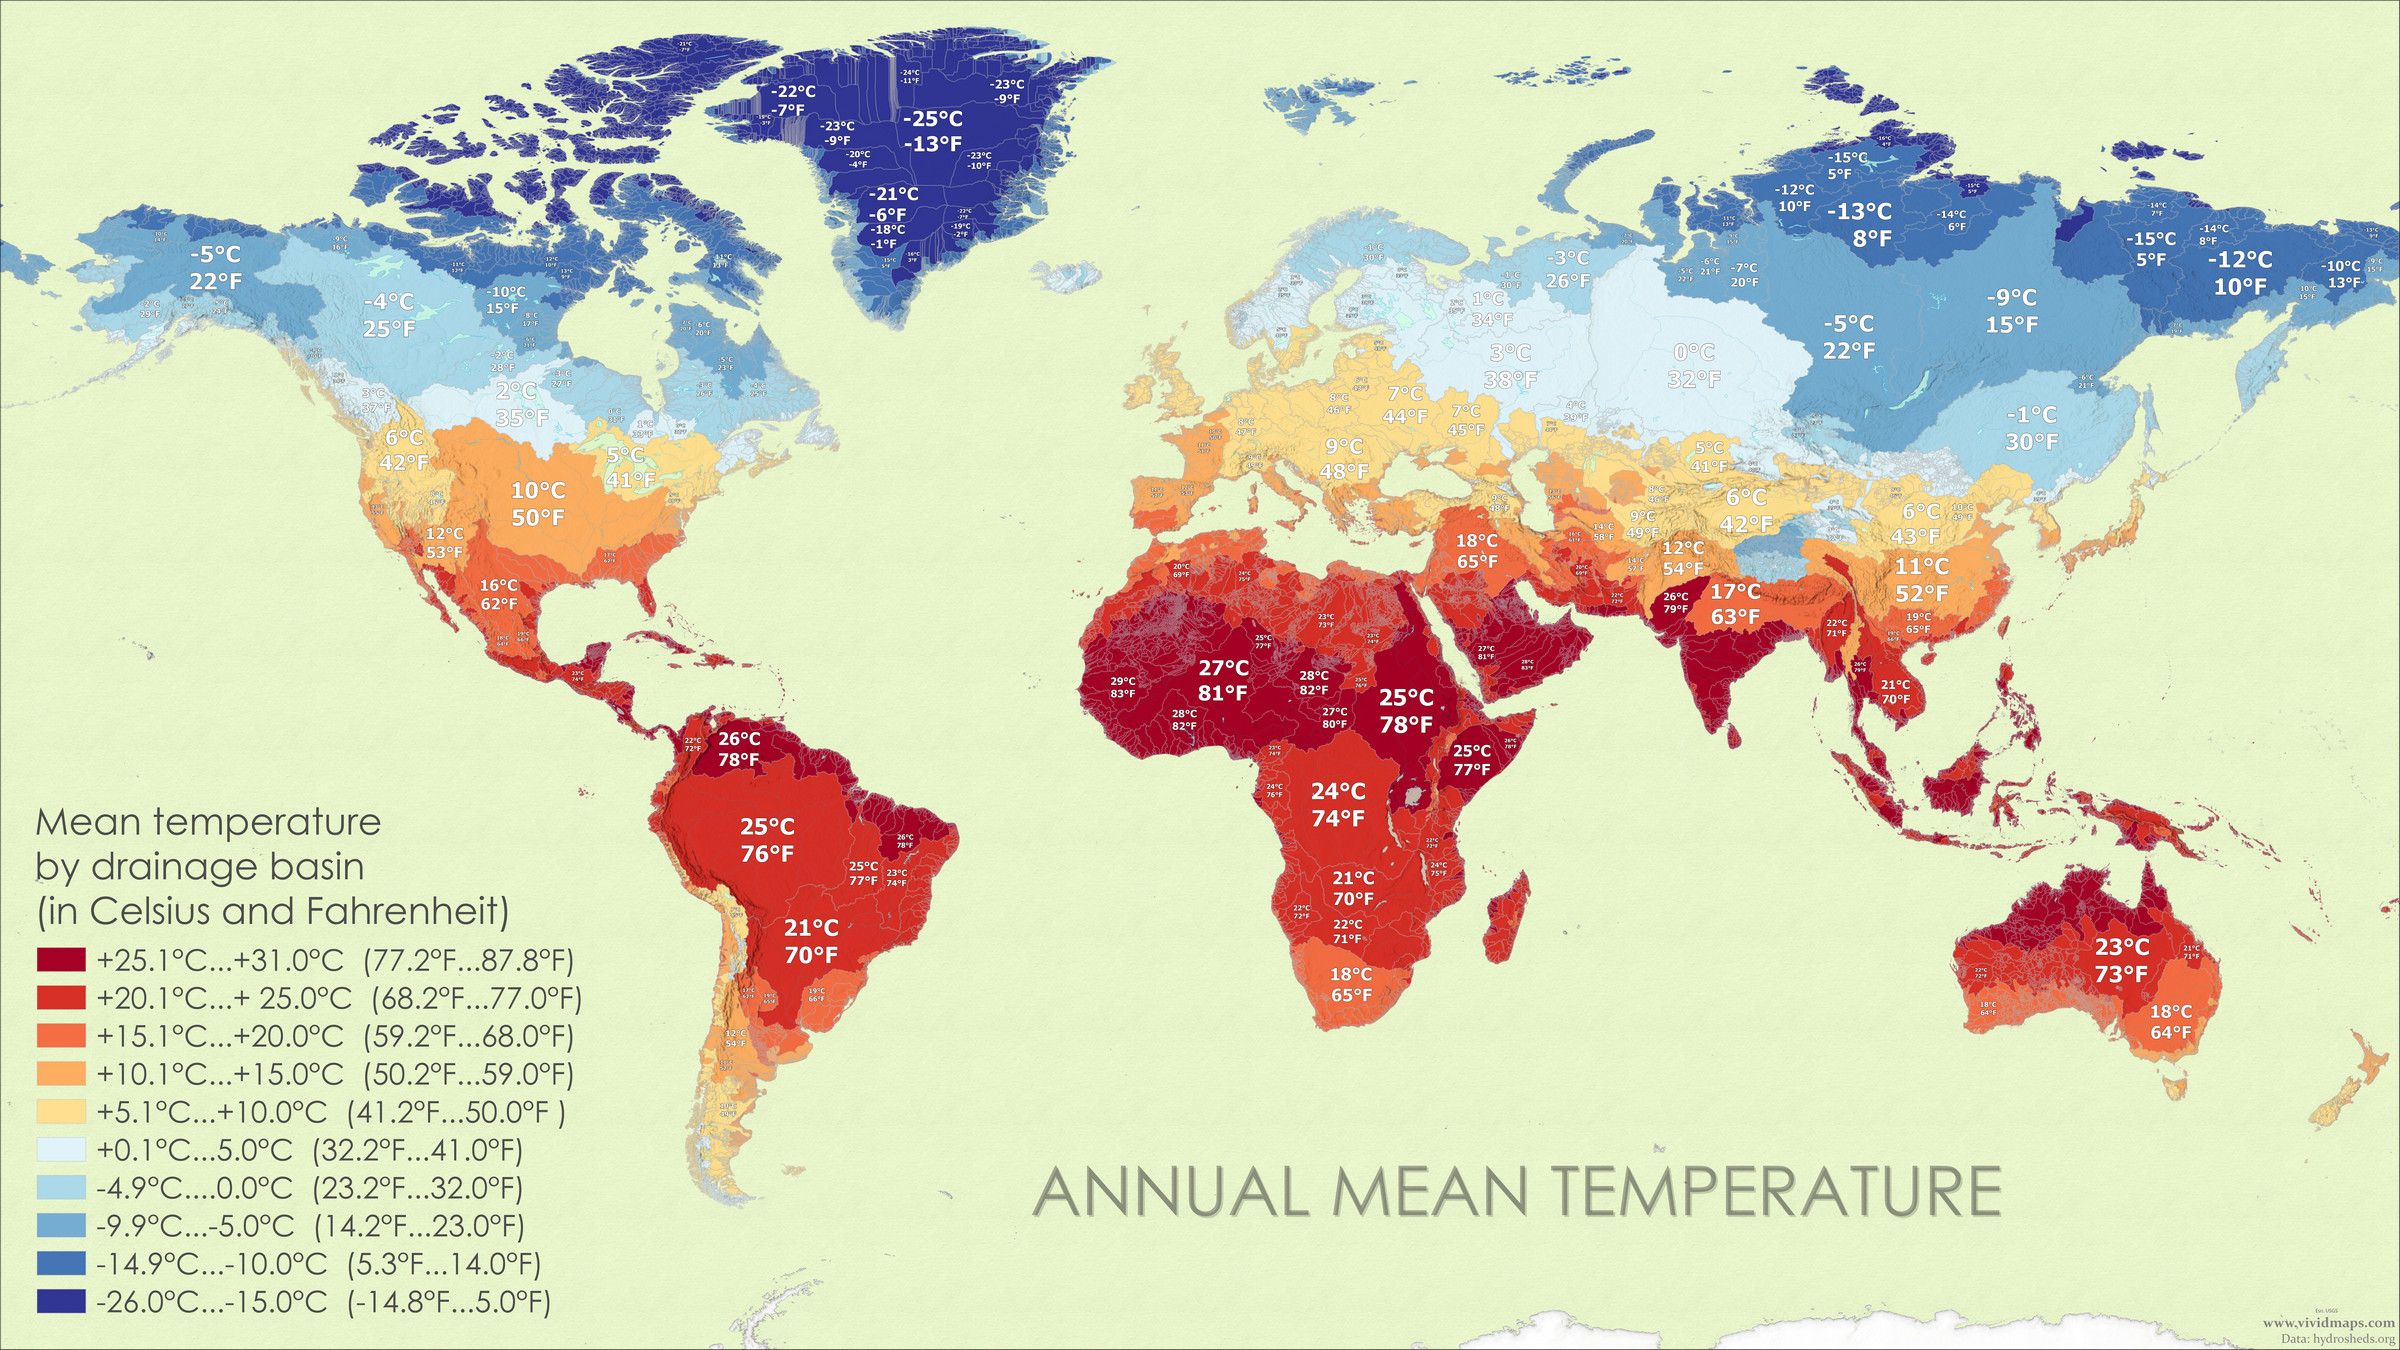
To add another layer to this watershed world, I pulled in climate data using WorldClim’s bioclimatic variables. Specifically, I used BIO1 (Annual Mean Temperature) and ran it through ArcGIS’s Zonal Statistics tool to find the median temperature for each basin.
World map of river basins by median annual temperature. [Click here for a high-resolution version]
The temperature map produced some interesting results. The ten warmest “countries” all share the same scorching median temperature of 31°C (87.8°F)—every one of them a tiny watershed in East Africa or the Arabian Peninsula. At the other extreme, the coldest basins huddle in Greenland with median temperatures around -26°C (-14.8°F).
One basin particularly caught my attention: Yanaland, named for the Yana River. This basin contains Verkhoyansk, often called the coldest city on Earth, yet its median annual temperature comes in at -15°C (5°F)—cold by any standard, but not quite the extreme you might expect from its reputation.
Precipitation Patterns
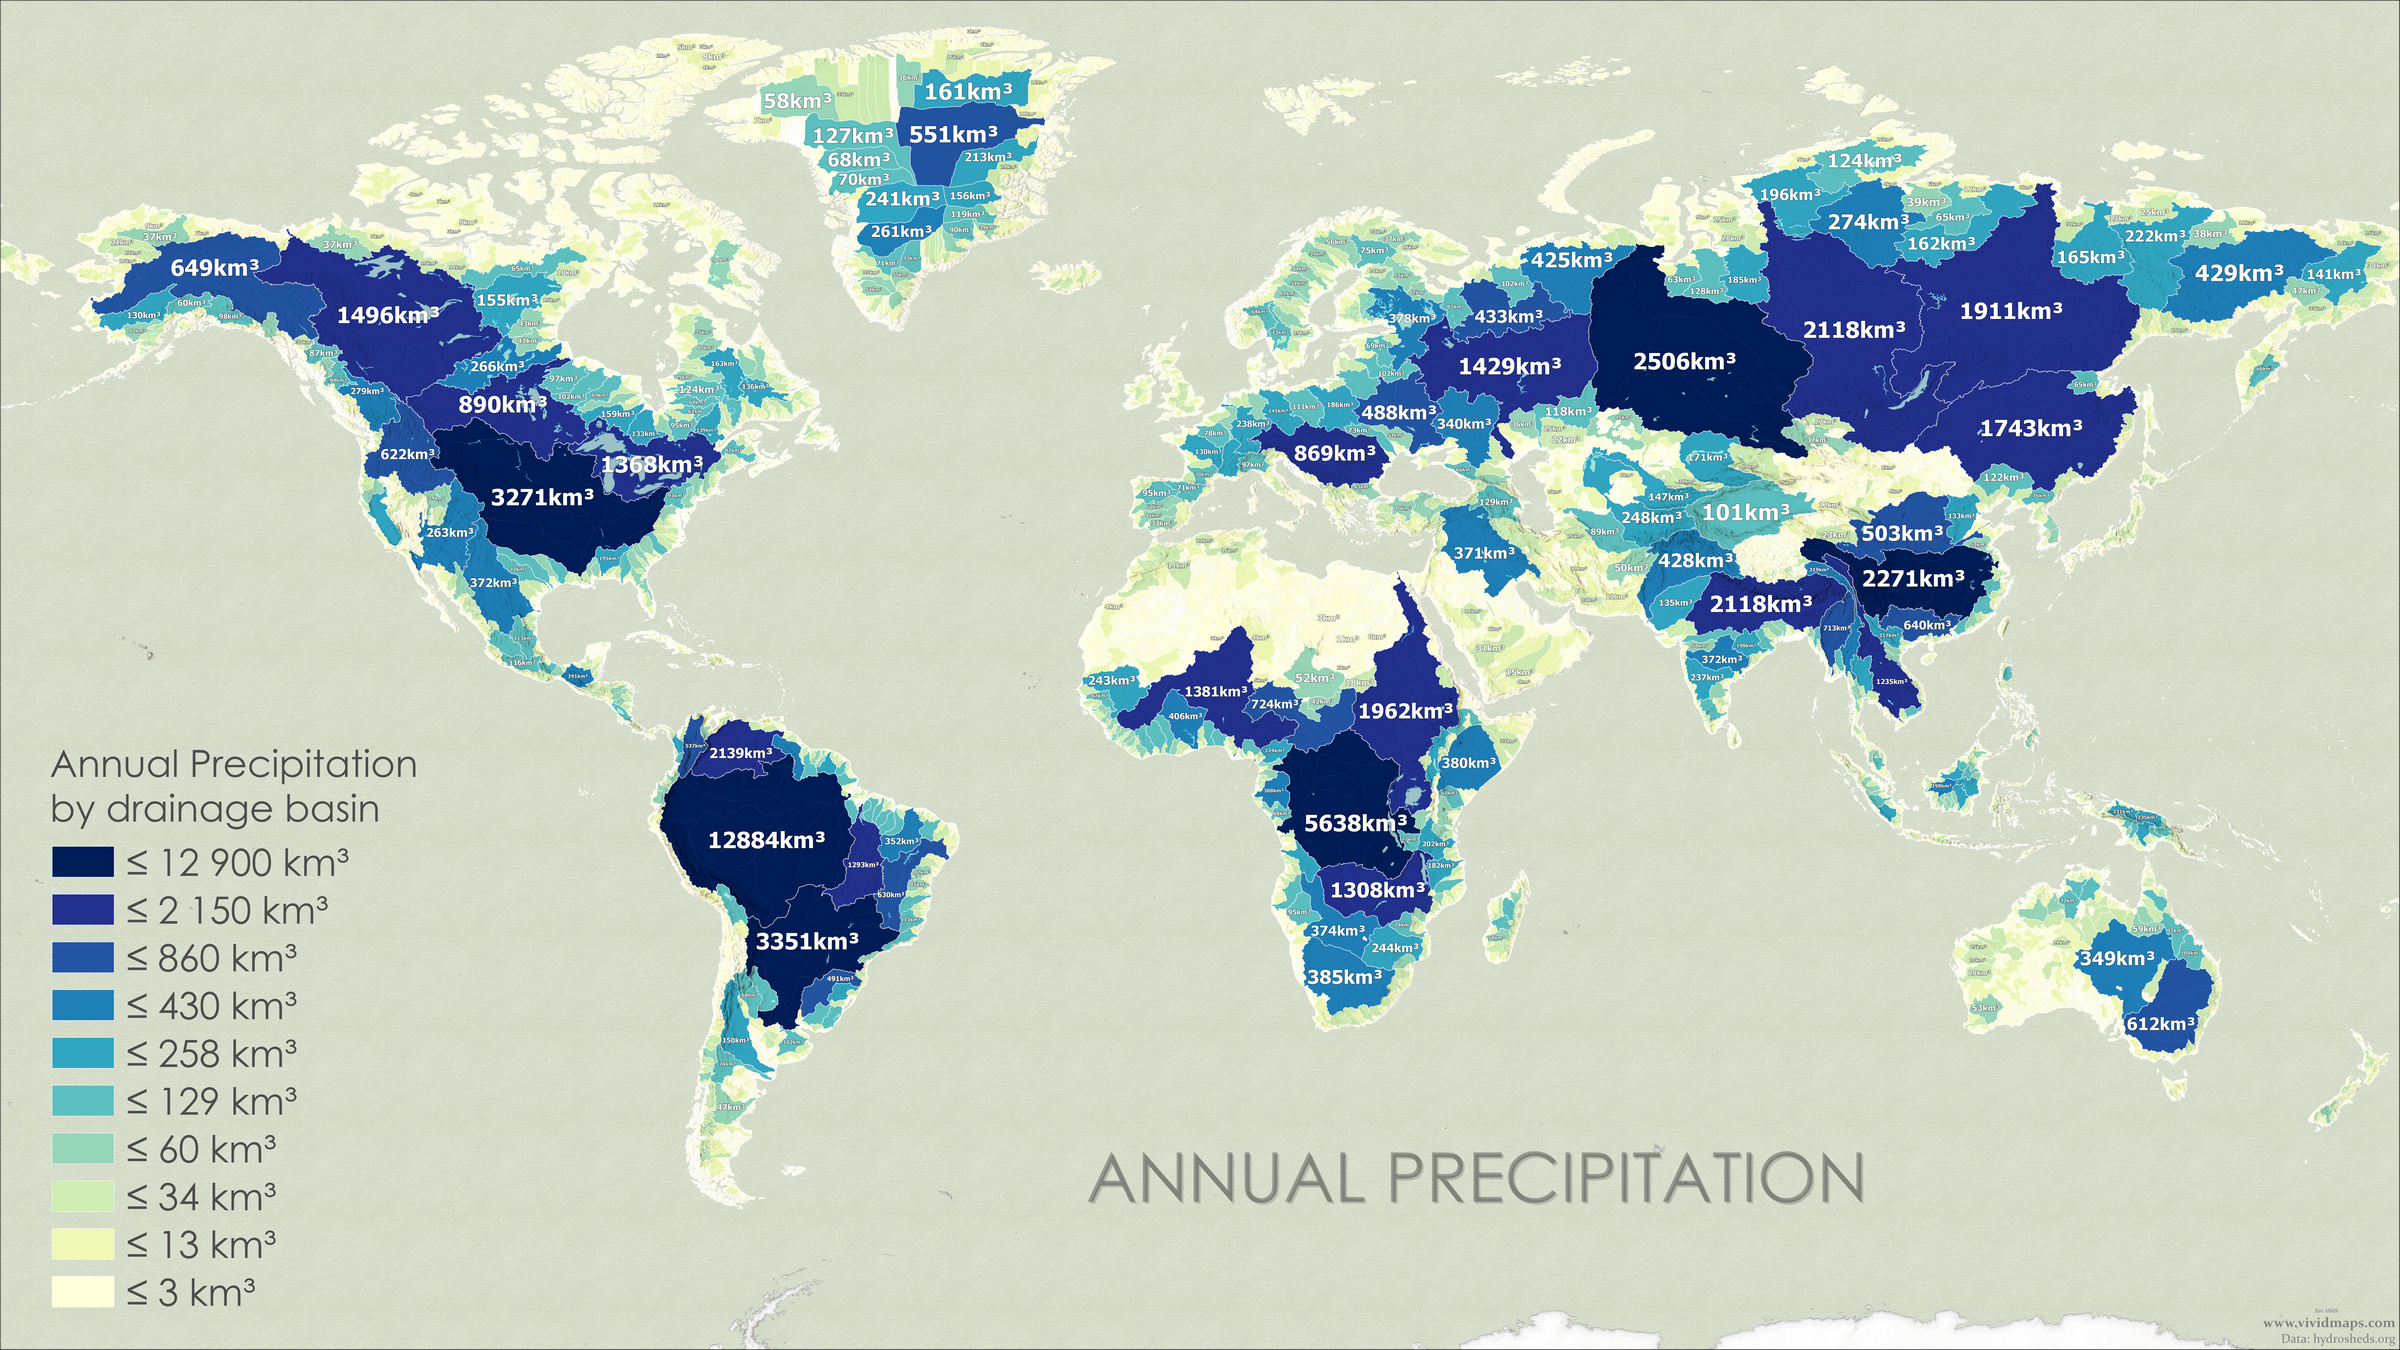
World map of river basins by annual precipitation volume. [Click here for a high-resolution version]
For precipitation, I used WorldClim’s BIO12 variable and summed all the rainfall within each basin using Zonal Statistics. The numbers are impressive. Take Amazonia—it receives 12,884 km³ (3,090 cubic miles) of rain every year. Yet the Amazon River itself only discharges about 7,280 km³ into the ocean annually (according to Wikipedia), roughly 17% of global river flow. Where does the rest go? It evaporates, gets absorbed by soil and vegetation, living organisms, or is used in human activities.
Country
River Basin
Annual Precipitation (km³)
Annual Precipitation (cubic miles)
Amazonia
Amazon
12,884
3,090
Congolia
Congo
5,638
1,352
Paranáland
Paraná
3,351
804
Mississippia
Mississippi
3,171
761
Obistan
Ob
2,506
601
Yangzonia
Yangtze
2,271
545
Orinocia
Orinoco
2,139
513
Yeniseiland
Yenisei
2,118
508
Gangetia
Ganges
2,118
508
Nilotic
Nile
1,962
471
These numbers really drive home the importance of watershed management. In places like India, where roughly 70% of people depend on agriculture, effective watershed development isn’t just theoretical—it’s the difference between prosperity and crisis. Done right, watershed management reduces erosion, recharges groundwater, controls flooding, and improves water quality throughout the system.
Population Distribution in Basin Countries
Next, I wanted to see where people actually live in this watershed world. Using the same Zonal Statistics approach with population data from SEDAC (the Socioeconomic Data and Applications Center), I mapped out how humanity distributes itself across these river basins.
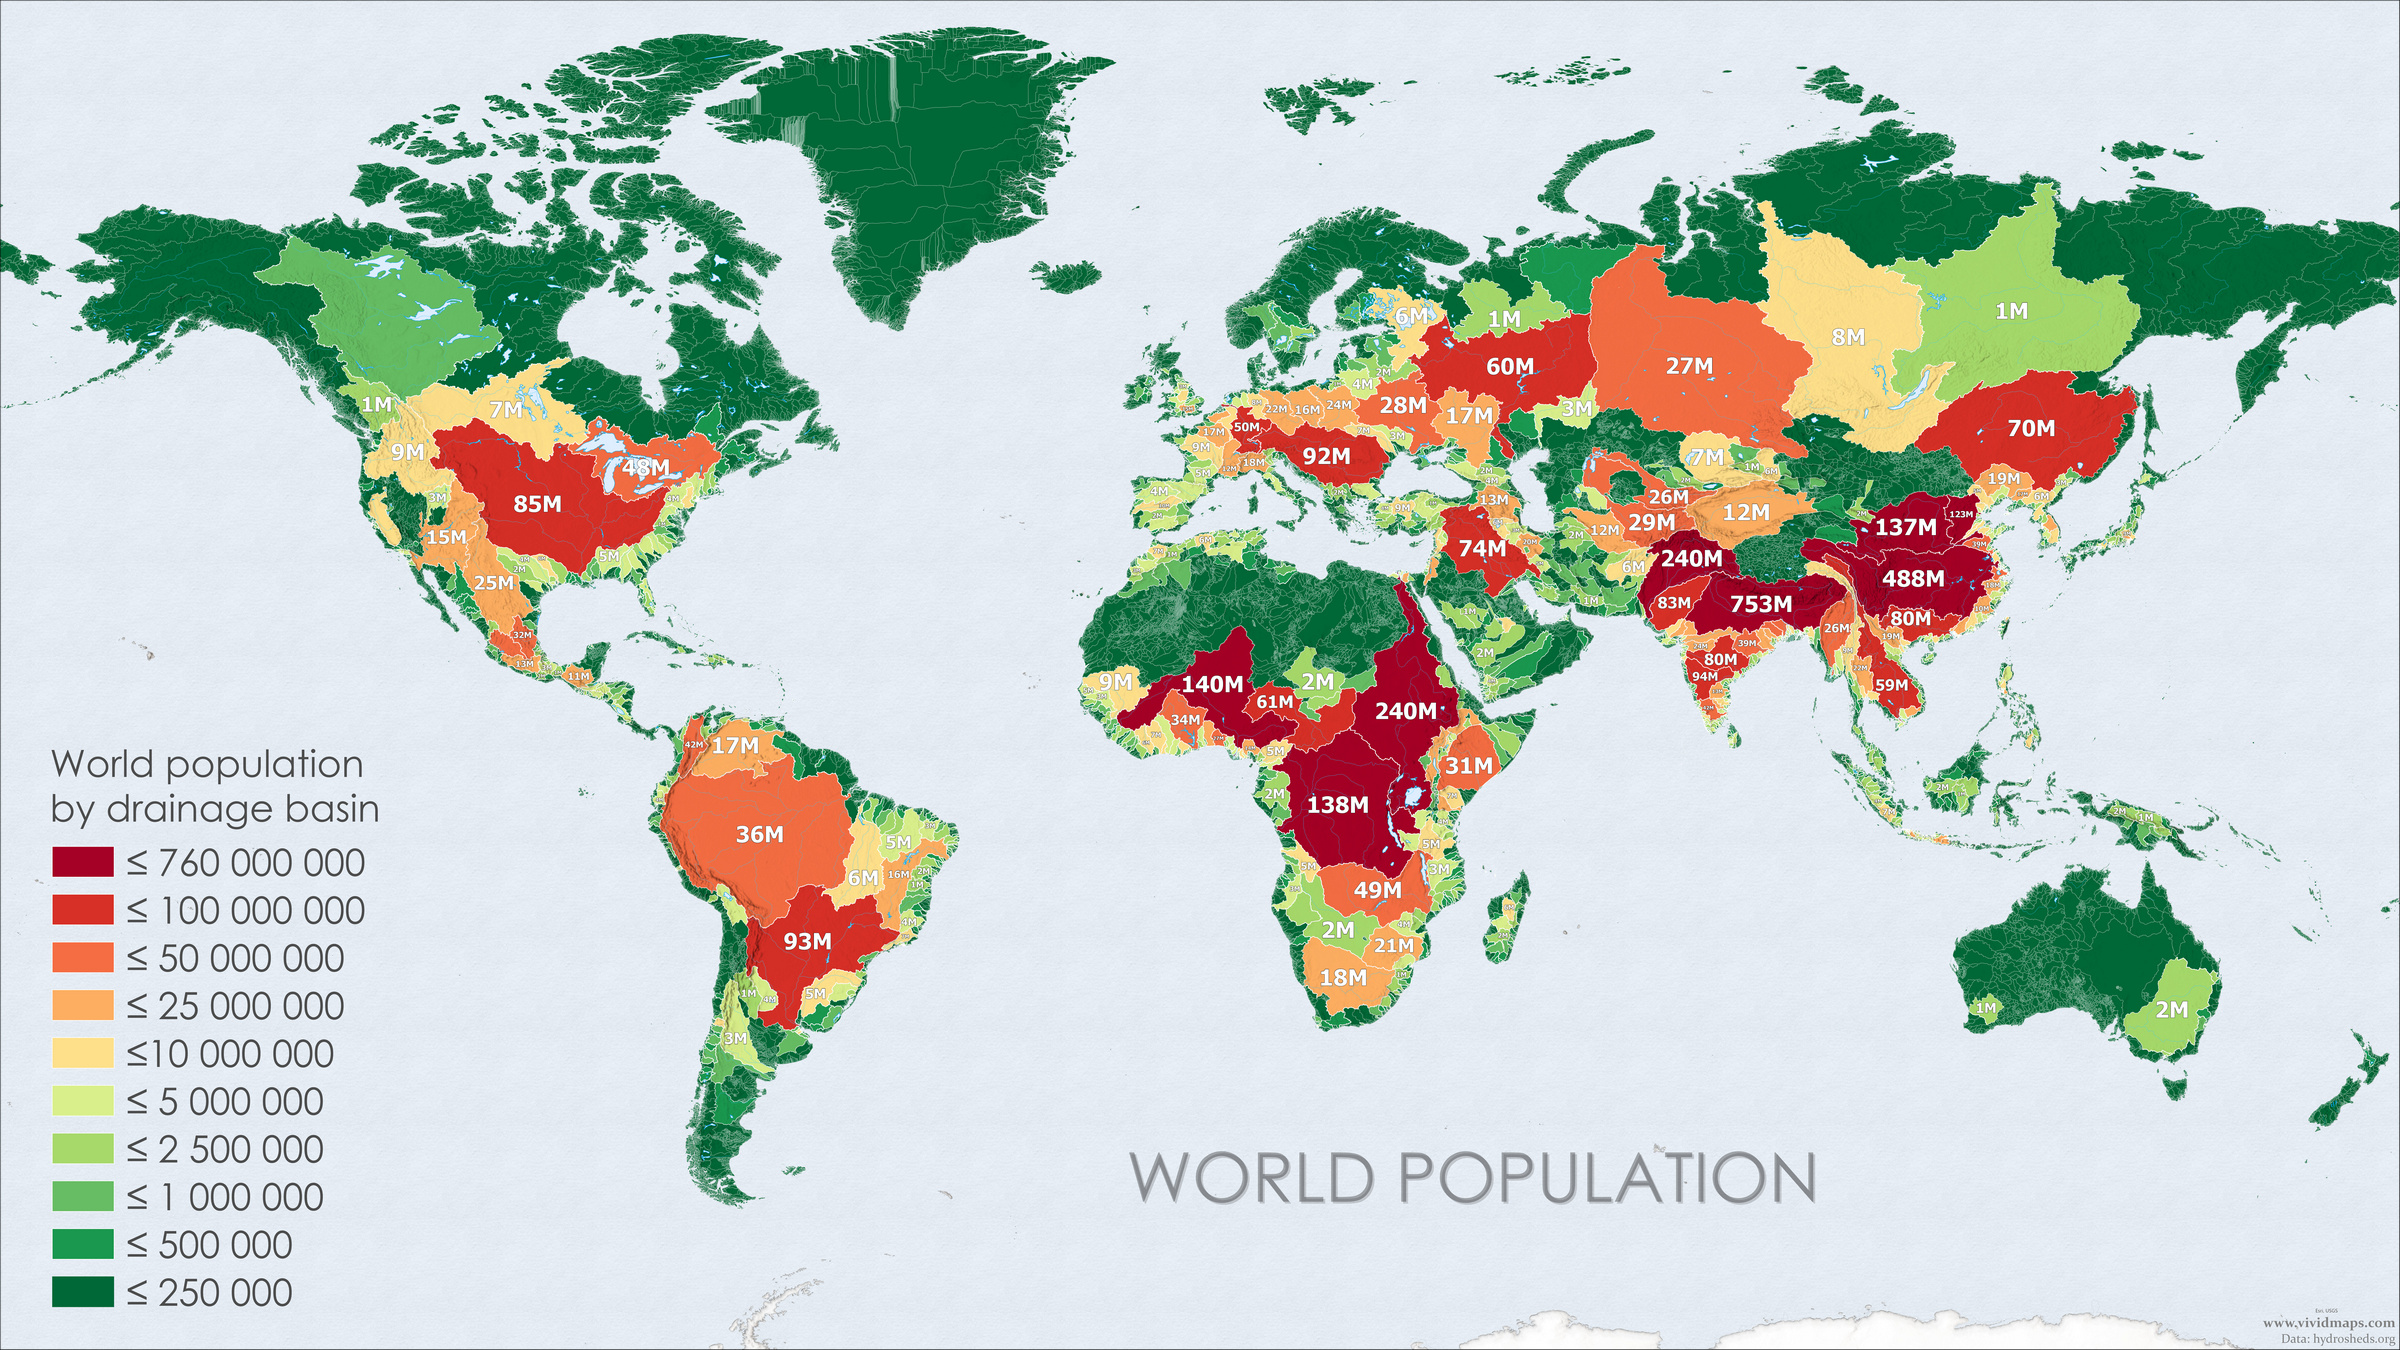
World map of river basins by population size. [Click here for a high-resolution version]
The most densely populated basins cluster where you’d expect—in Asia, where major rivers have supported civilizations for millennia:
Country
River Basin
Population
Gangetia
Ganges
752,847,000
Yangzonia
Yangtze
488,390,000
Industan
Indus
240,040,000
Nilotic
Nile
239,592,000
Nigerland
Niger
140,466,000
Congolia
Congo
138,283,000
Huangland
Huang
137,219,000
Duliujianstan
Duliujian
122,545,000
Krishnaland
Krishna
94,072,000
Paranáland
Paraná
93,252,200
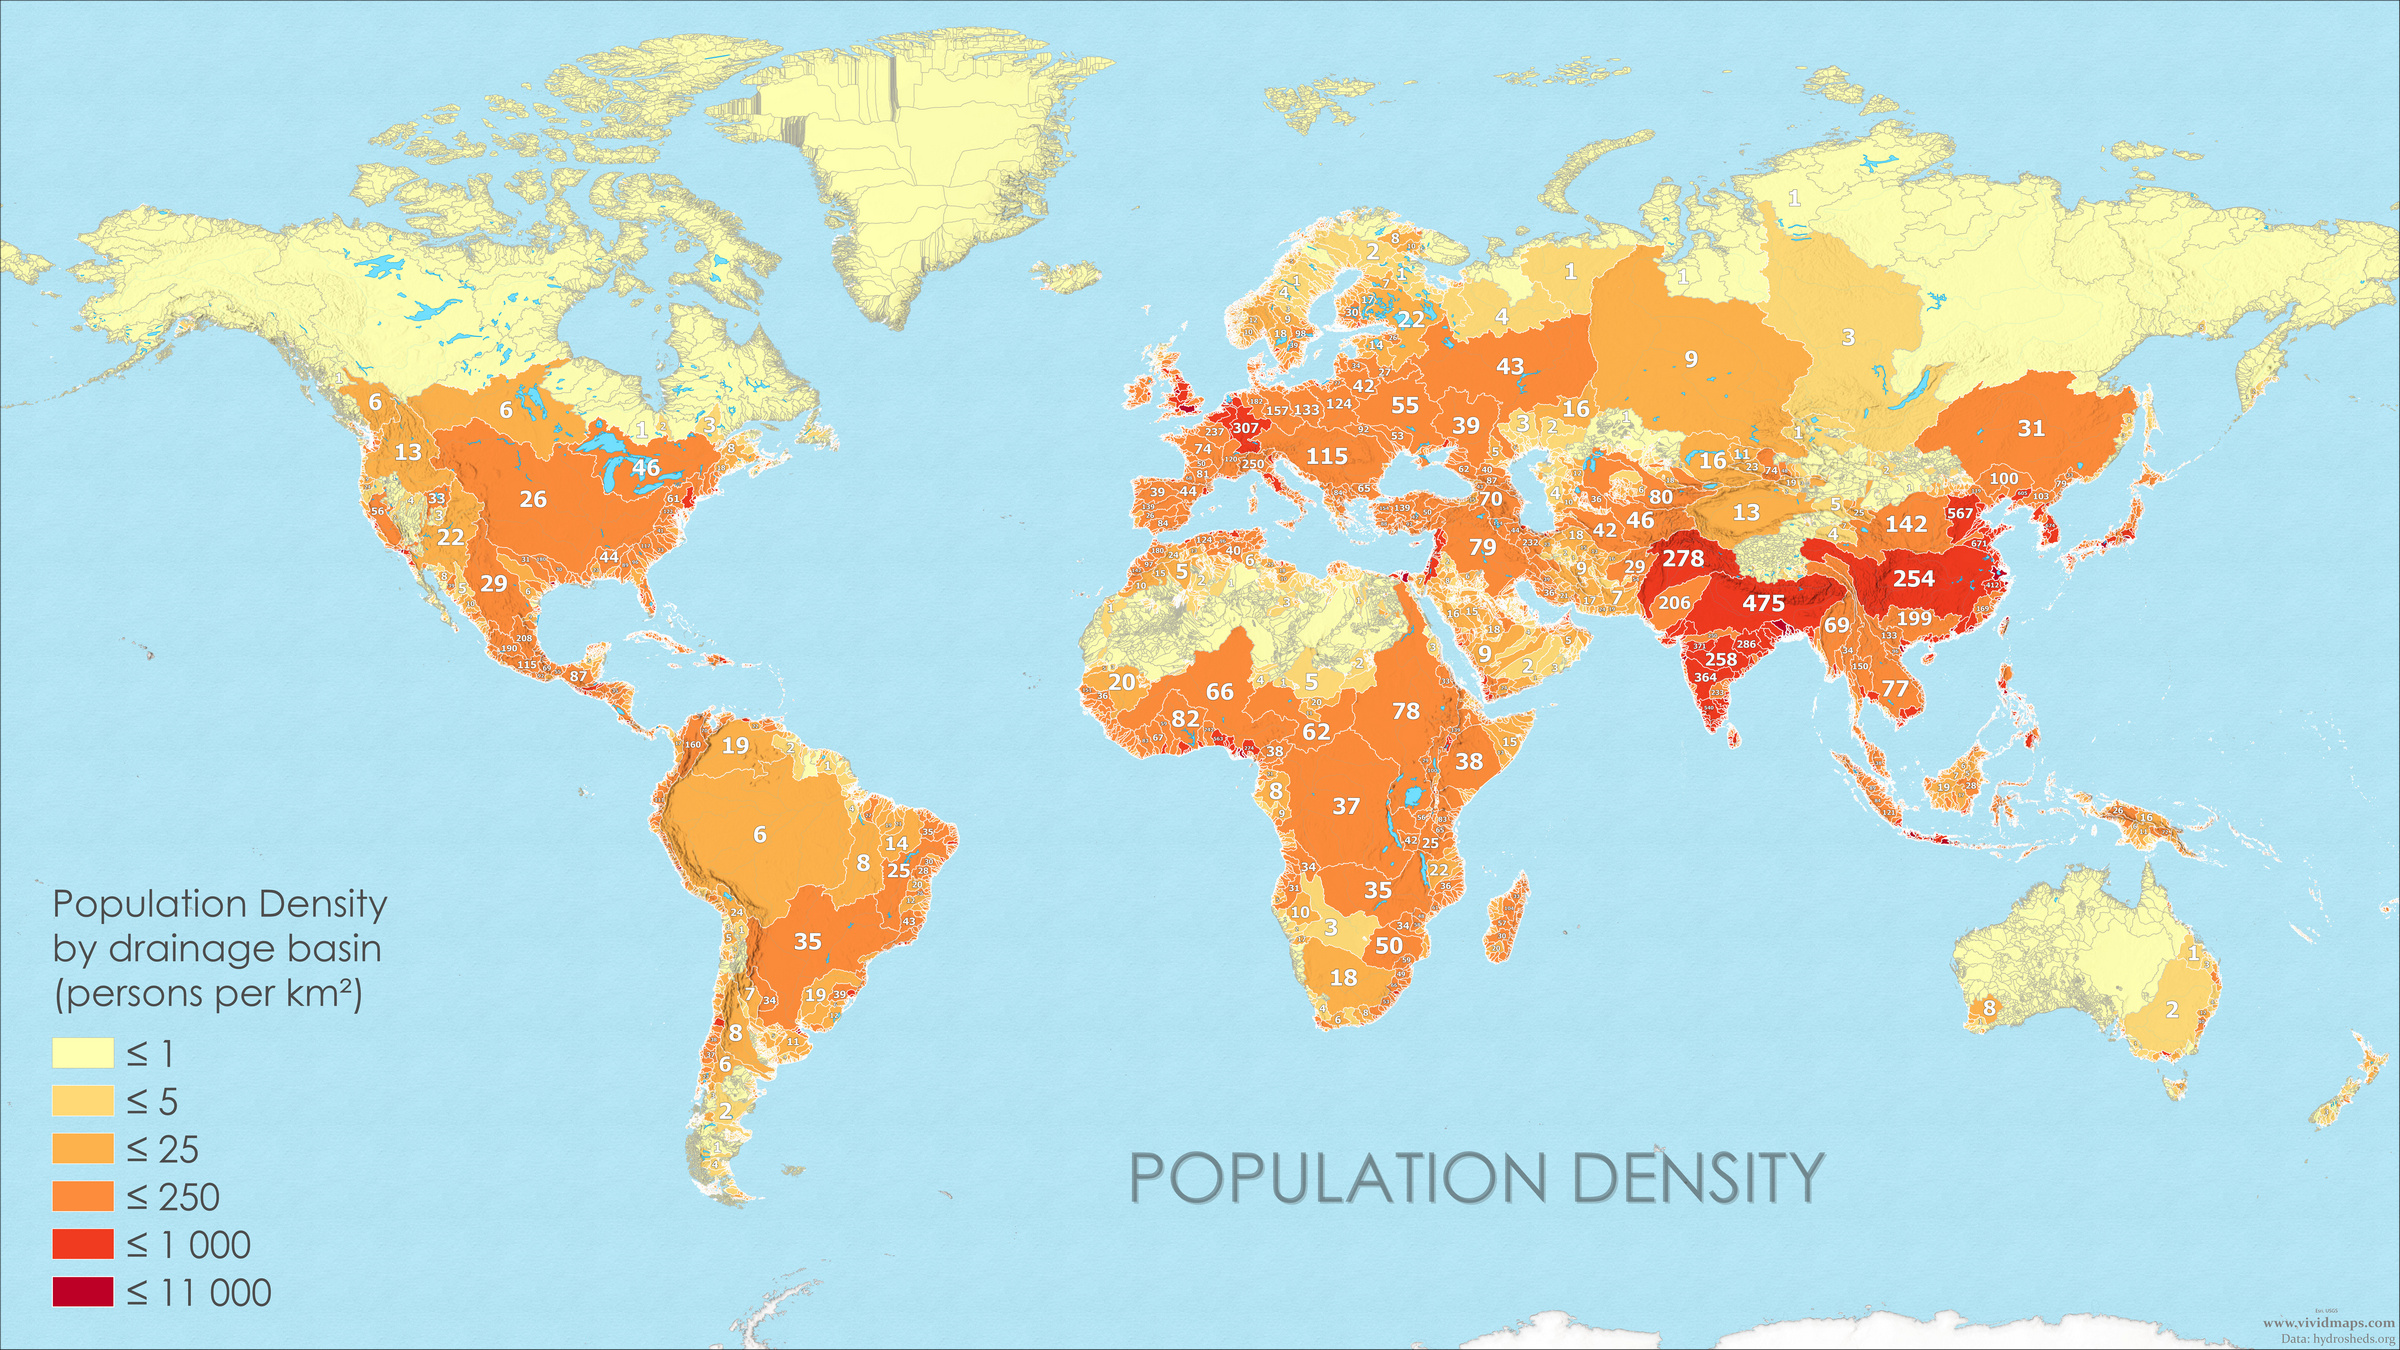
World map of river basins by population density. [Click here for a high-resolution version]
According to the population density map, the highest concentrations of people can be found in tiny watersheds along the coasts of Africa and Asia. This creates a real challenge for watershed management—in densely packed areas, human activity can overwhelm a basin’s natural capacity to filter and recycle water.
Economic Landscape of Basin Countries
Finally, I explored the economic potential of our basin countries using the Zonal Statistics tool and GDP raster data for 2025 (in millions of US dollars) from SEDAC.
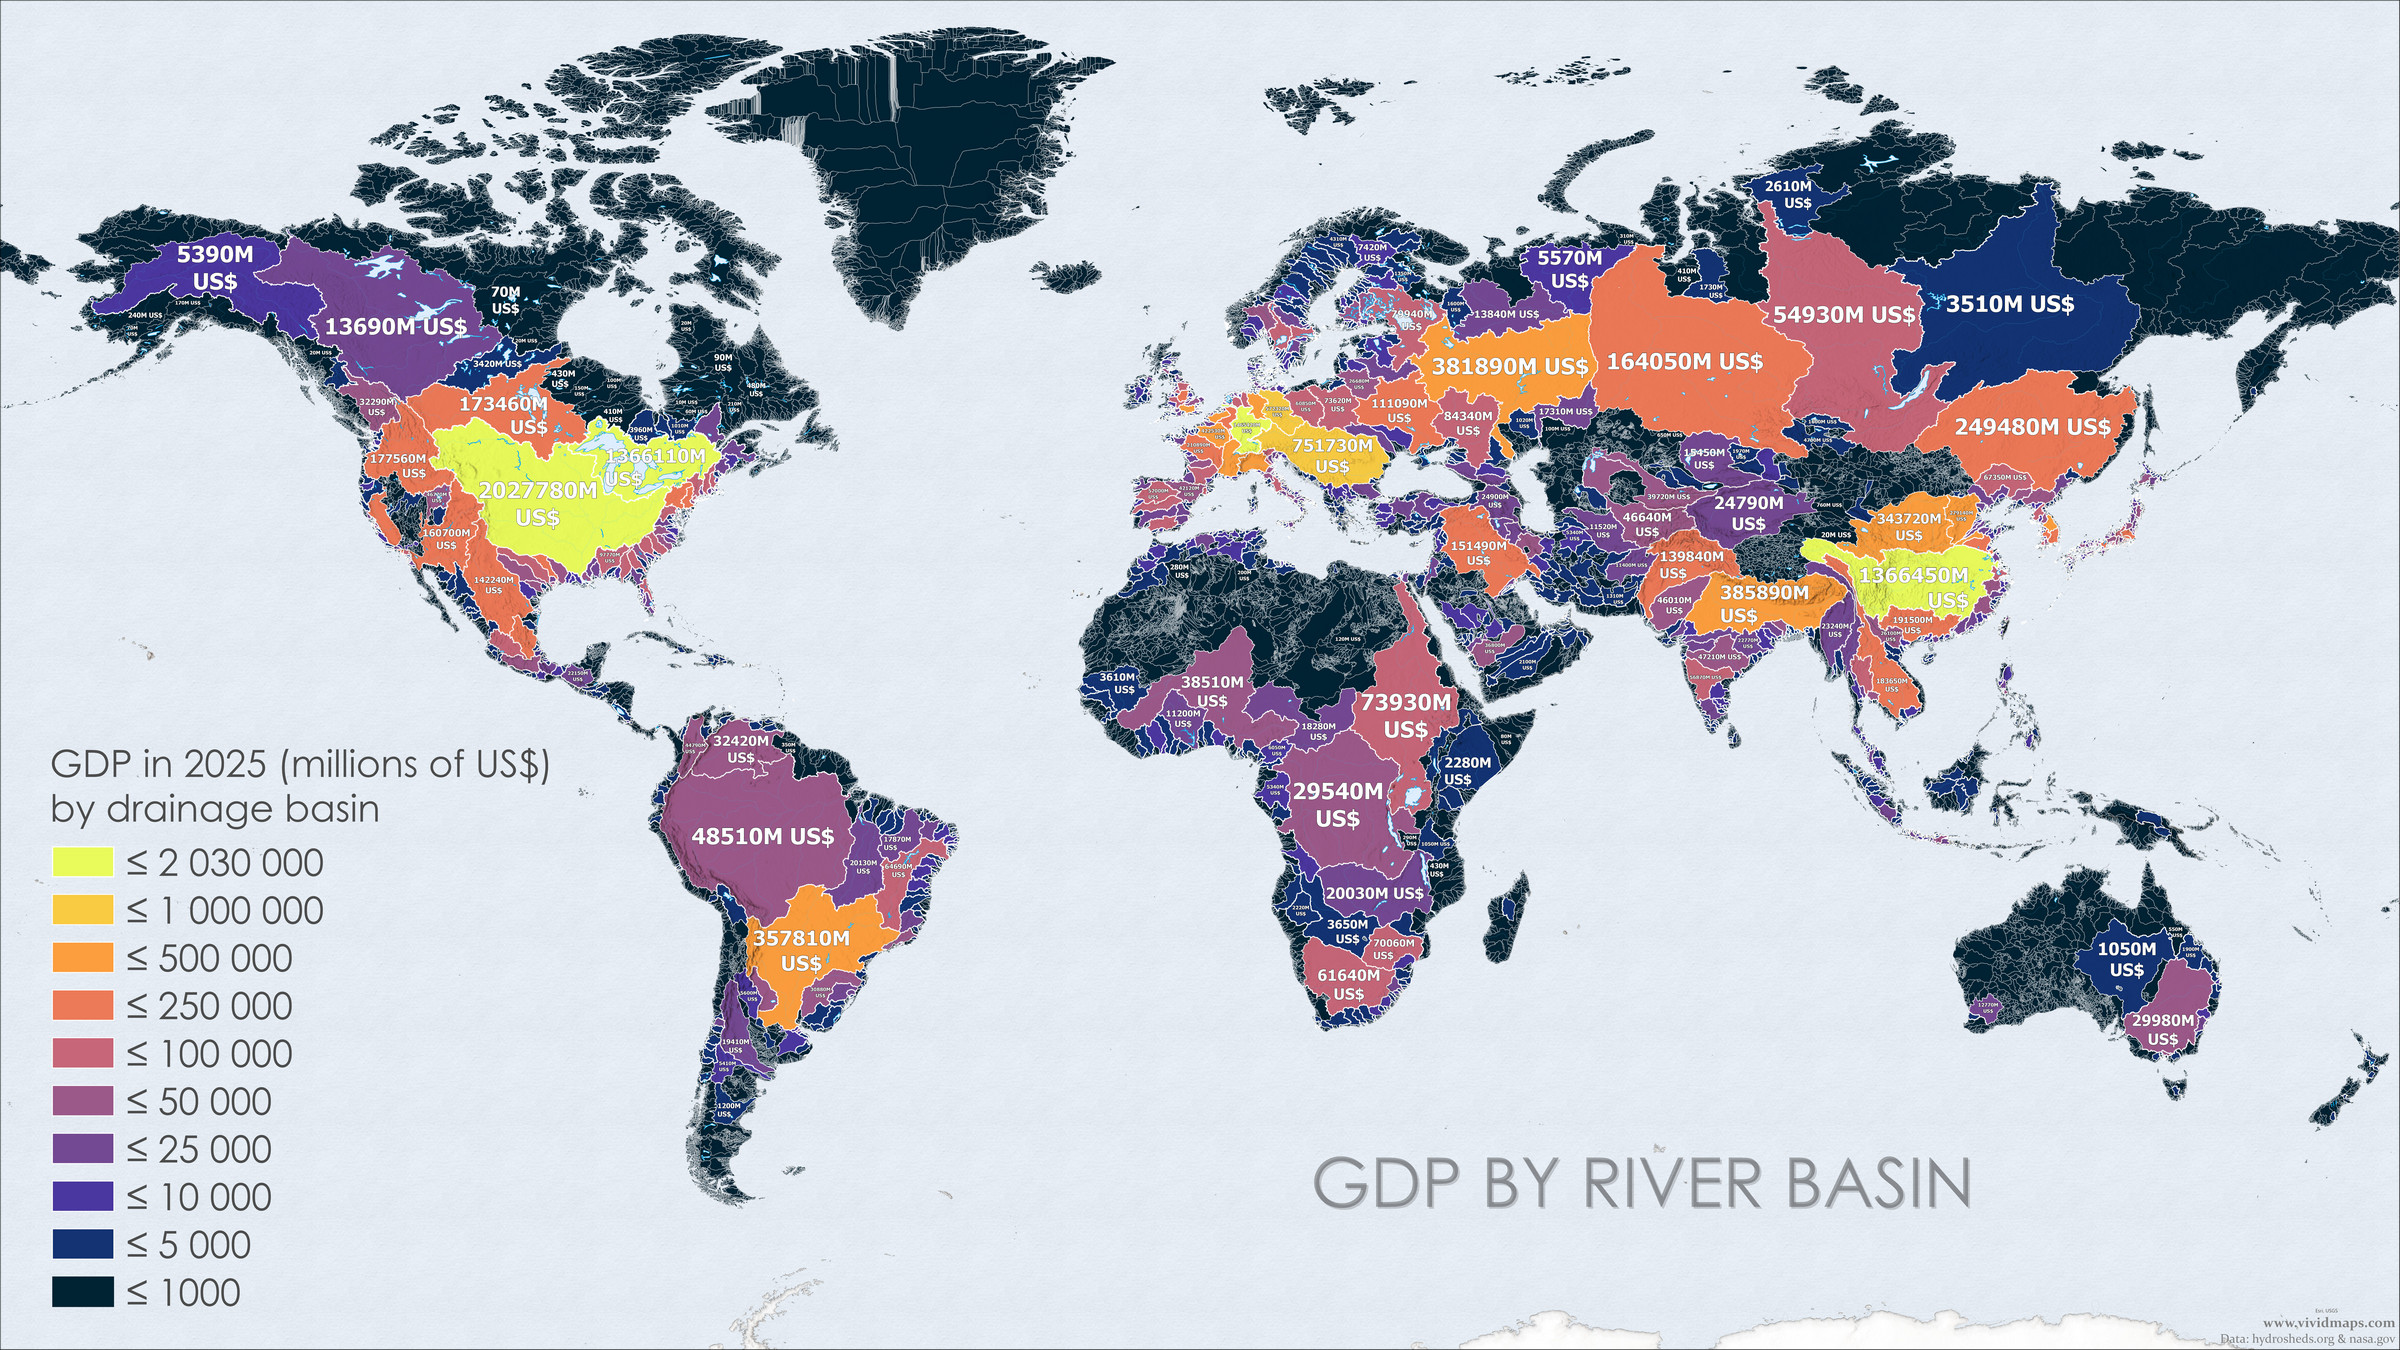
World map of river basins by Gross Domestic Product (GDP). [Click here for a high-resolution version]
Country
River Basin
GDP (millions USD)
Mississippia
Mississippi
2,027,780
Rhineland
Rhine
1,465,420
Yangzonia
Yangtze
1,366,450
Laurentia
St. Lawrence
1,366,110
Danubia
Danube
751,730
Kamtinland
Kam Tin
699,610
Elbeland
Elbe
572,320
Hanland
Han
451,490
Seinia
Seine
422,530
Povia
Po
399,230
The economic leaders aren’t always the biggest or most populous basins. Size doesn’t automatically translate to wealth.
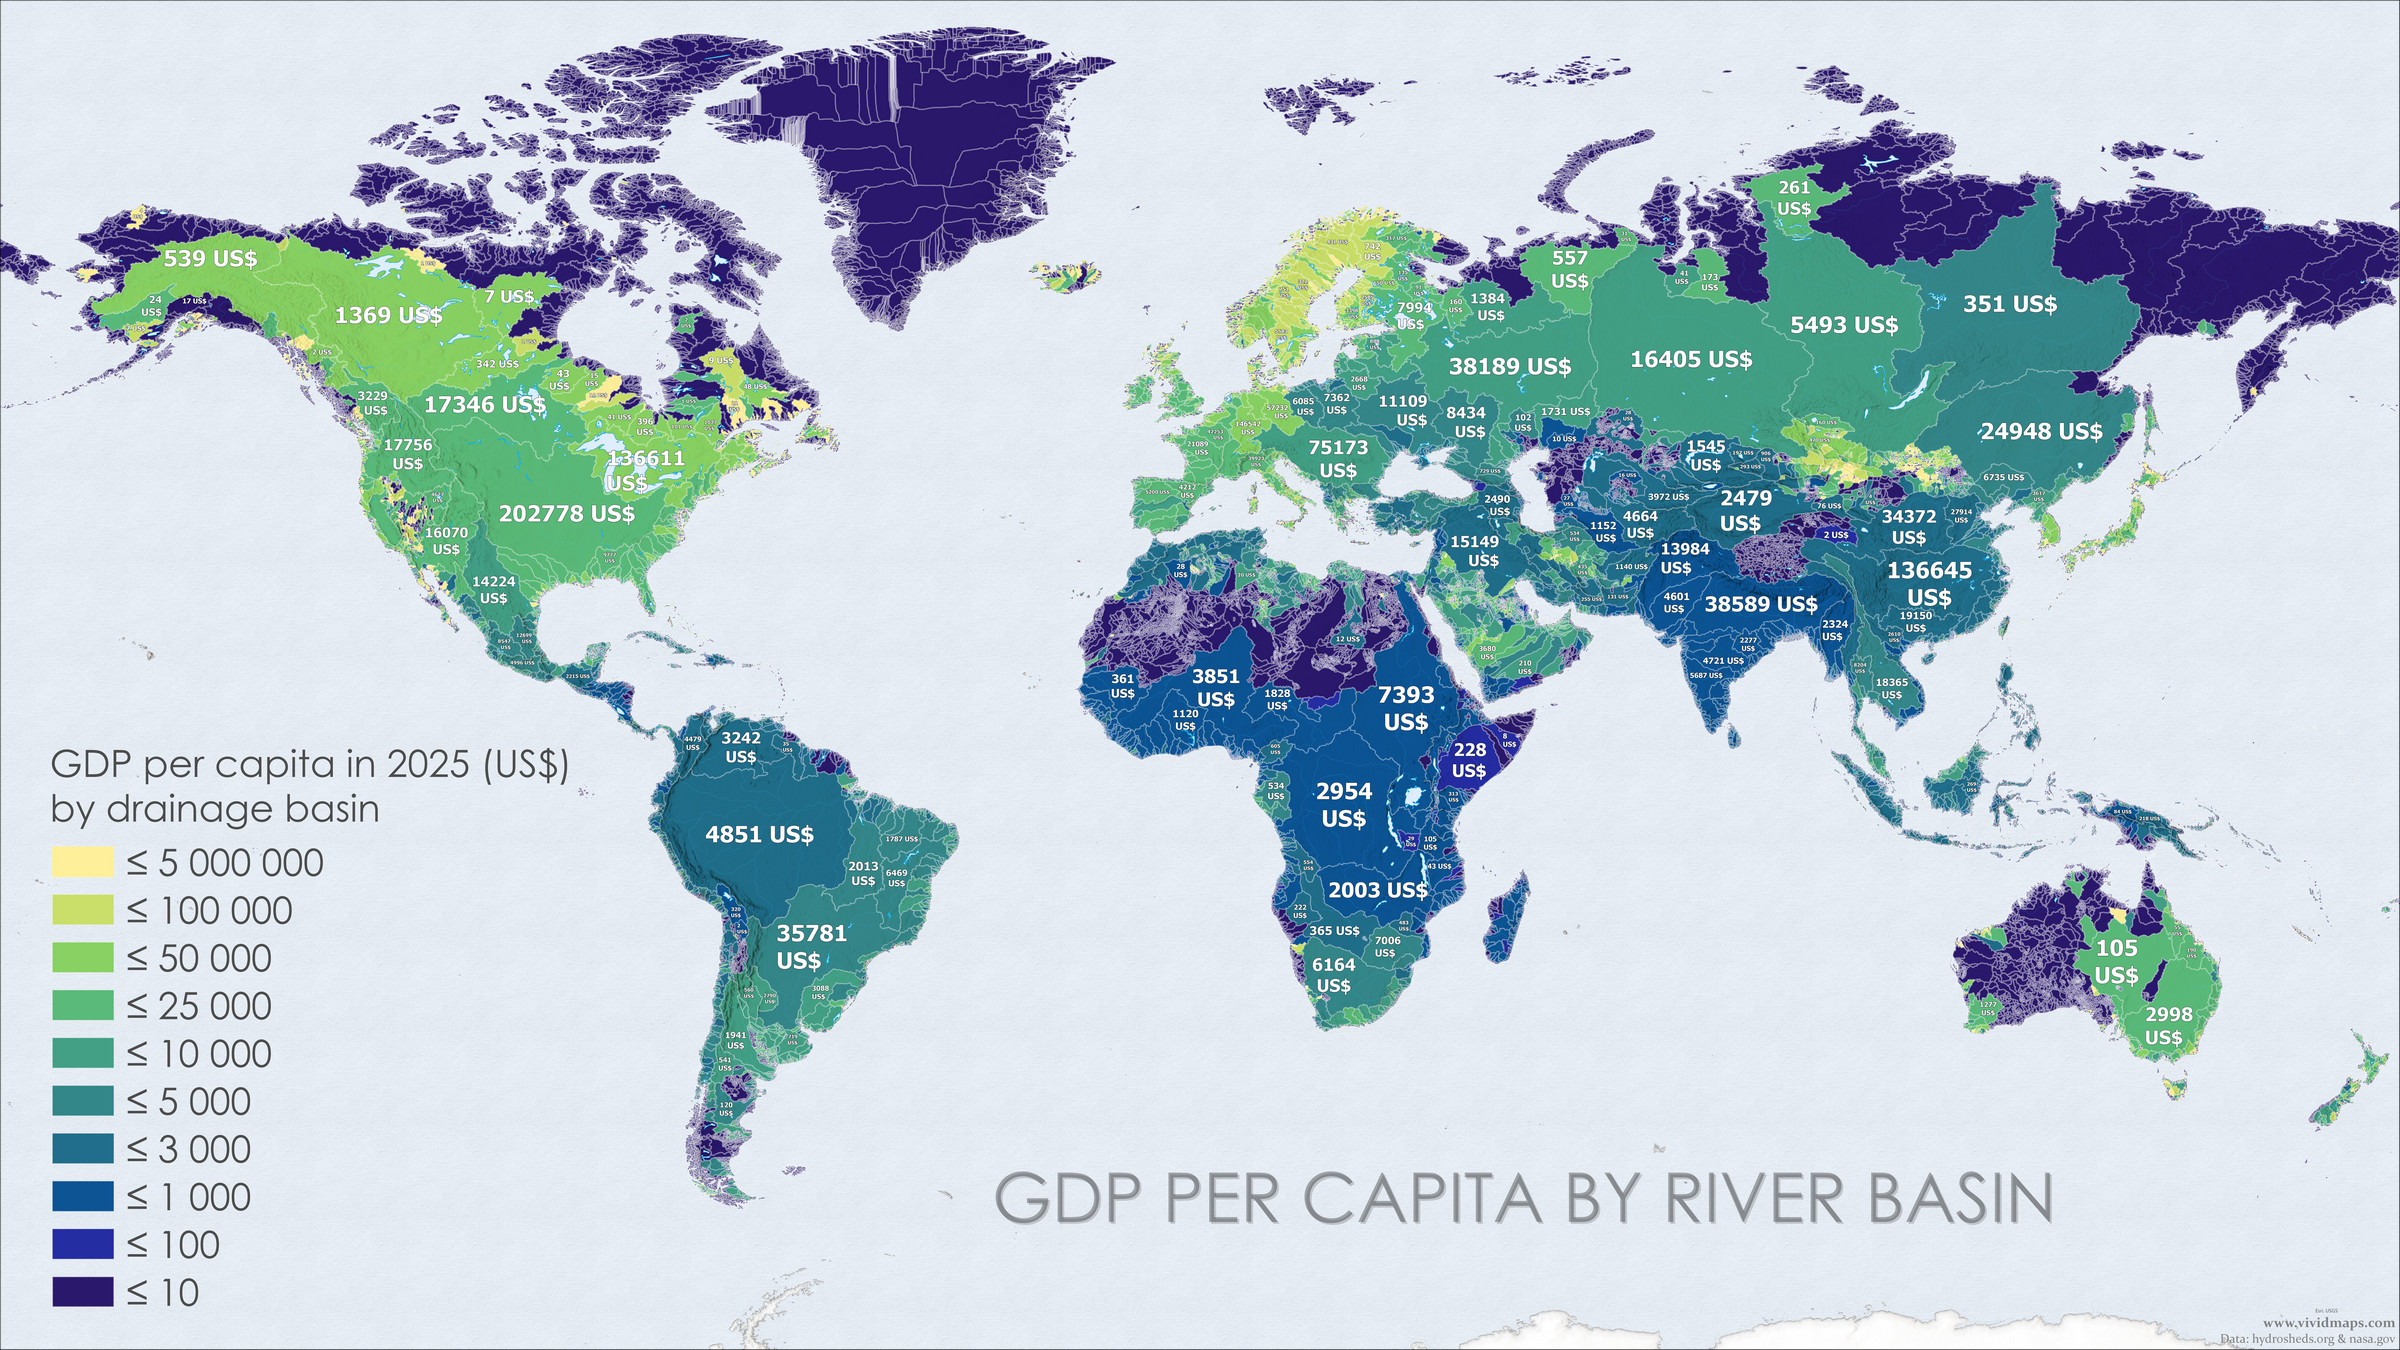
World map of river basins by GDP per capita. [Click here for a high-resolution version]
The per capita GDP map produced some truly surprising outliers:
The Aloh Besar River basin in Bahrain: 464 people, $2,260 million GDP ($4,866,030 per capita)
Crystal River basin in Florida: 191 residents, $910 million GDP ($4,757,180 per capita)
River Mite basin in the UK: 263 inhabitants, $1,000 million GDP ($3,605,710 per capita)
The Potential of Watershed-Based Management
Creating these maps wasn’t just an exercise in cartographic creativity. It got me considering what basin-wide management could actually accomplish. There are some well-established principles that could work much more effectively if we managed resources at the watershed scale:
Utilizing land according to its capacity
Maintaining adequate vegetation cover on the soil
Conserving rainwater where it falls through in-situ conservation
Managing excess water to prevent erosion and recharge groundwater
Maximizing productivity per unit of area, time, and water
Increasing cropping intensity through intercropping and sequence cropping
Safely utilizing marginal lands through alternative land use systems
Ensuring ecosystem sustainability within the watershed
Maximizing income from the interrelated crop-livestock-tree-labor complex over time
Apply these principles across an entire watershed, and you could see real improvements in how we manage water, protect ecosystems, and develop sustainably.
Wrapping Up
Mapping the world by watersheds instead of political boundaries does more than create interesting visuals. It reminds us that water doesn’t respect the lines we draw, and that our planet functions as a series of interconnected systems that often bear little resemblance to our geopolitical divisions.
Will we actually redraw borders to match watersheds? Almost certainly not. But this exercise points to something important: as we grapple with climate change, water scarcity, and resource competition, organizing around watersheds rather than countries might help us develop solutions that actually work with natural systems instead of against them.
The maps suggest a different way of seeing our world—one where the flow of water defines the boundaries of cooperation, where ecosystem health carries as much weight as economic growth, and where we recognize that what happens upstream inevitably affects what happens downstream.
What do you see in these maps? Could watershed-based management change how we approach global challenges? Would aligning resources with natural boundaries help or create new problems? I’d love to hear your perspective in the comments below.
If you’re interested in exploring more traditional world maps, check out these highly-rated options available on Amazon:
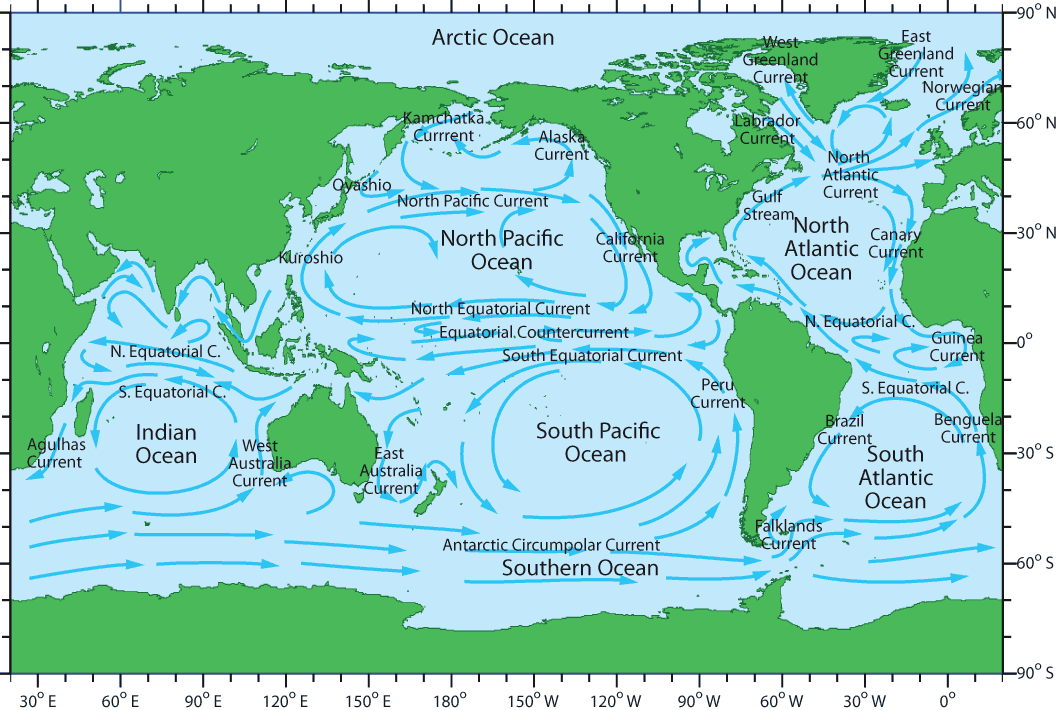
Very informative and fun! A natural and alive representation of land. And the land regions could be subdivided into continental divides [1,2], each with its correspondent ocean gyre [3,4].
That’s a great idea! It would also be great to create such maps. The easiest map to create would involve subdividing the land into continental regions.
Ani
6 months ago
Fantastic analysis! I was messing around with the idea, then realized that you had already done 100X the research. I’m an ecologist/biologist and I think that watersheds are the optimal organization considering the climate with human and animal ecology. I also think that human conflict could be managed much better if we were organized by natural structures like watersheds.
I completely agree with you. I’ve been thinking about this a lot as well. River basins function as semi-isolated systems where the flow of water, soil, and energy shapes everything—from vegetation patterns to wildlife habitats and even human settlement. That’s why I believe the ‘basin principle’ should serve as a foundation for both environmental protection and economic planning. Organizing around natural systems like watersheds just makes ecological—and practical—sense.


")
Very informative and fun! A natural and alive representation of land. And the land regions could be subdivided into continental divides [1,2], each with its correspondent ocean gyre [3,4].
[1]
[2] https://en.wikipedia.org/wiki/Continental_divide
[3]
[4] https://rwu.pressbooks.pub/webboceanography/chapter/9-1-surface-gyres/
That’s a great idea! It would also be great to create such maps. The easiest map to create would involve subdividing the land into continental regions.
Fantastic analysis! I was messing around with the idea, then realized that you had already done 100X the research. I’m an ecologist/biologist and I think that watersheds are the optimal organization considering the climate with human and animal ecology. I also think that human conflict could be managed much better if we were organized by natural structures like watersheds.
I completely agree with you. I’ve been thinking about this a lot as well. River basins function as semi-isolated systems where the flow of water, soil, and energy shapes everything—from vegetation patterns to wildlife habitats and even human settlement. That’s why I believe the ‘basin principle’ should serve as a foundation for both environmental protection and economic planning. Organizing around natural systems like watersheds just makes ecological—and practical—sense.