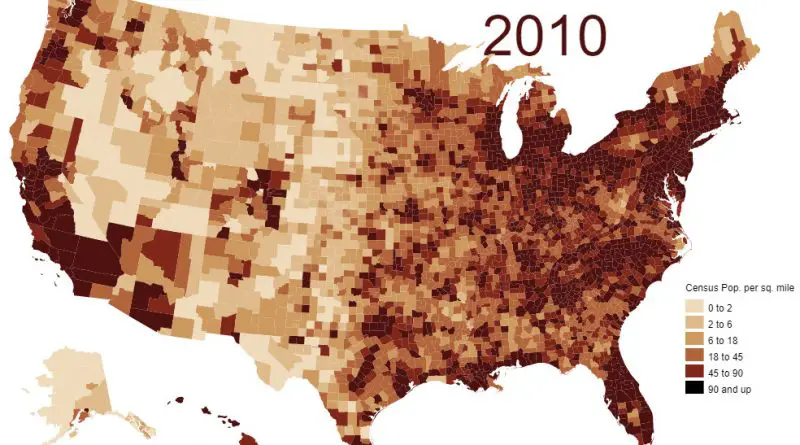
US Population Growth Mapped
A visual and analytical journey through America’s population changes, highlighting key historical moments and demographic shifts.
Read MoreMaps of the US
A visual and analytical journey through America’s population changes, highlighting key historical moments and demographic shifts.
Read More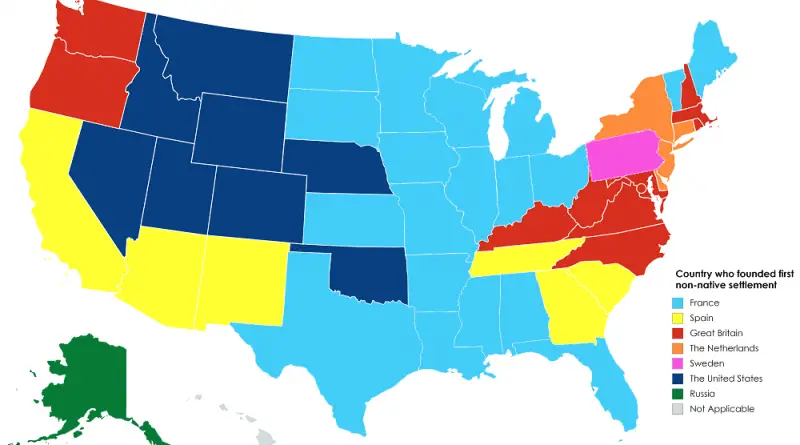
Before the U.S. existed, global powers raced to plant their flags on its land. This map shows the first foreign country to settle in each U.S. state, with the fascinating mix of empires that once dreamed of ruling America.
Read More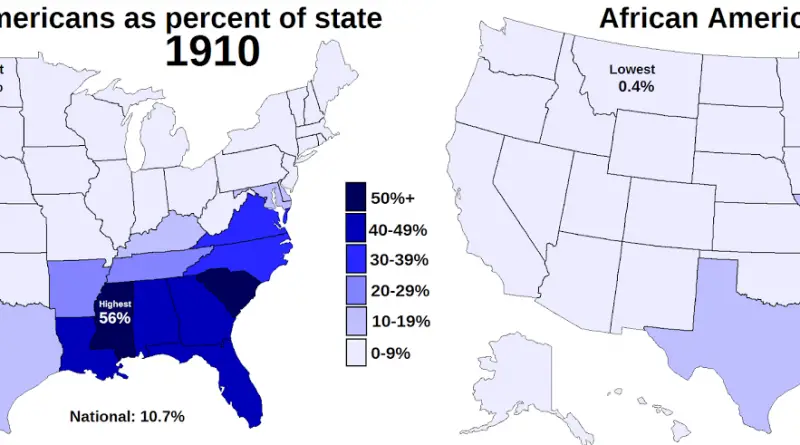
Where African Americans reside today is the culmination of a century of migration, transformation, and survival. This post uses historical maps, census records, and animated graphics to trace the path of the Black population in the United States—initially in the Deep South in 1910, then to cities, and now back again in the current New Great Migration.
Read More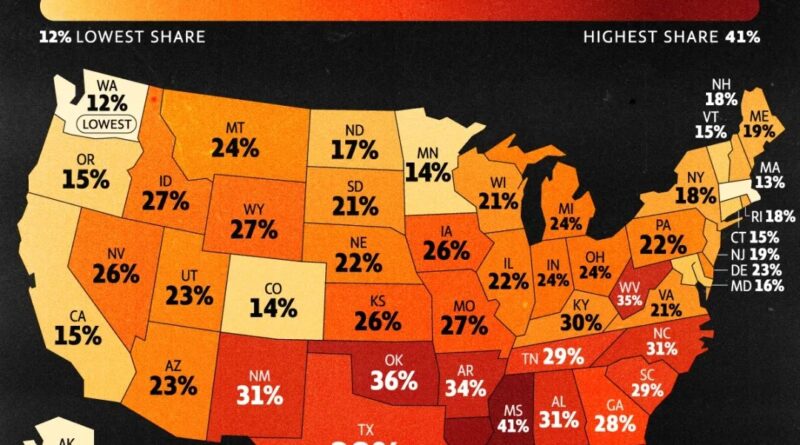
Which U.S. states have the highest share of low-wage workers? Using new data from the Economic Policy Institute, we explore where earnings fall short and reveal the geographic patterns shaping economic life across America.
Read More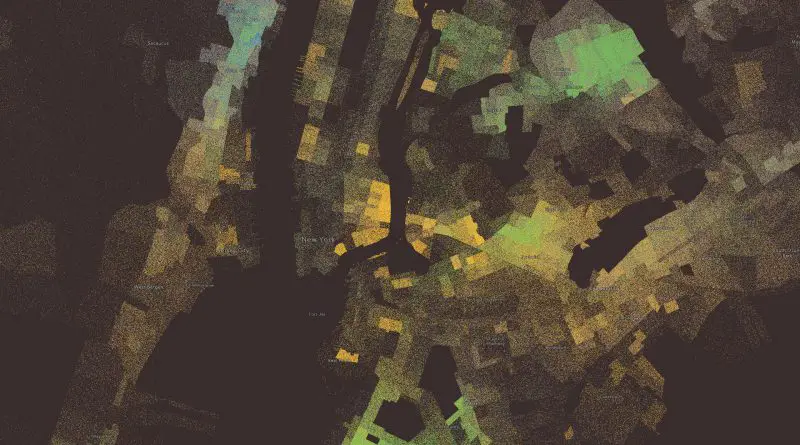
New York City’s Hispanic population is one of the largest and most diverse in the U.S. Hispanics make up 29.8% of the city’s population (2.6 million people). The Hispanic population in NYC is made up of individuals with roots in many nations. Puerto Ricans make up the largest single Hispanic group in the city.
Read More
Explore the religious landscape of the U.S. from 1890 to 2010 through maps I created using ARDA data. See how religion has shaped different areas over time.
Read More
Where you grow up can shape your financial future. We explore which U.S. regions offer the greatest opportunities for upward mobility—and what individuals and policymakers can do to close the gap.
Read More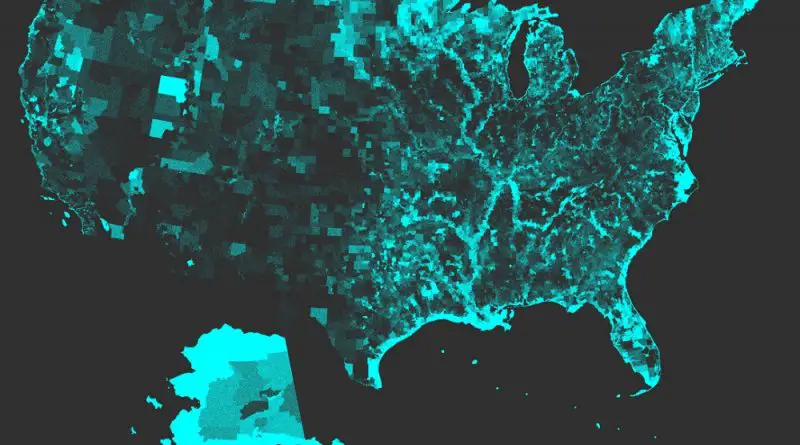
States like Michigan have an abundance of water resources, while others like New Mexico have very little. This is revealed by a thorough analysis of U.S. Census Tracts. This distribution affects the quality of the water and presents problems for water management in the future.
Read More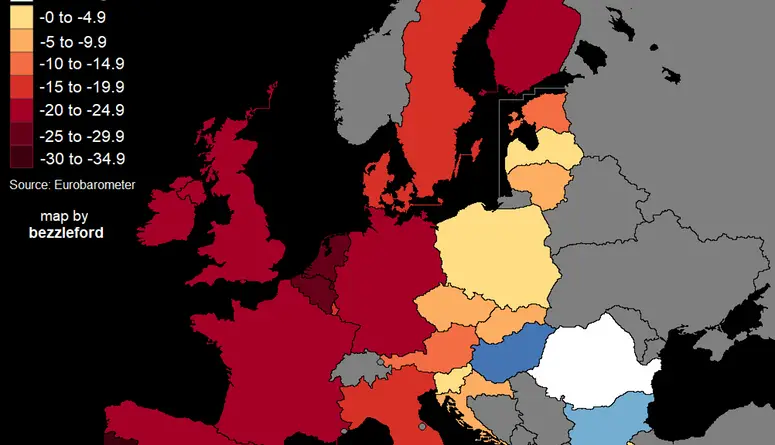
Percentage point change in those who held a positive view of the United States. Reddit user bezzieford, Data: Eurobarometer 2017
Read More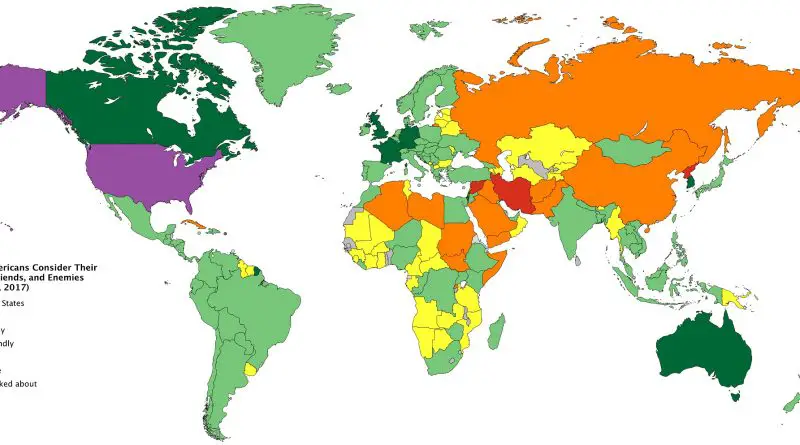
A map shows how Americans view other nations—friends, foes, or unfamiliar. It’s a glimpse into global opinion shaped by history, politics, and perception.
Read More