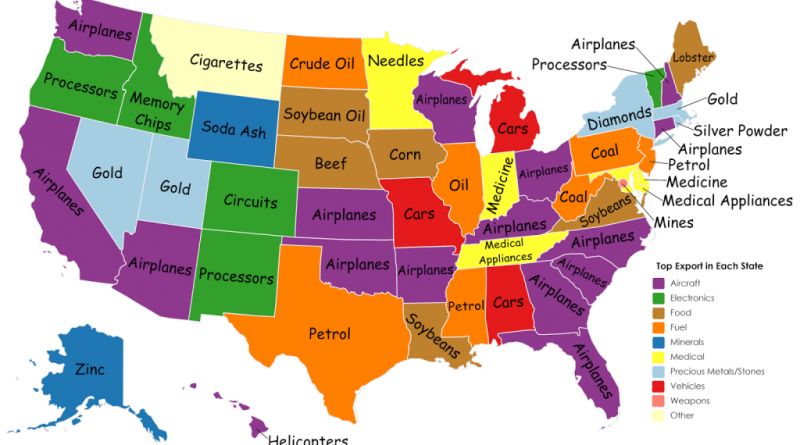
Top Export in Each U.S. State
Reddit user: sendherhome22 Source: US Census Bureau
Read MoreMaps of the US
Reddit user: sendherhome22 Source: US Census Bureau
Read More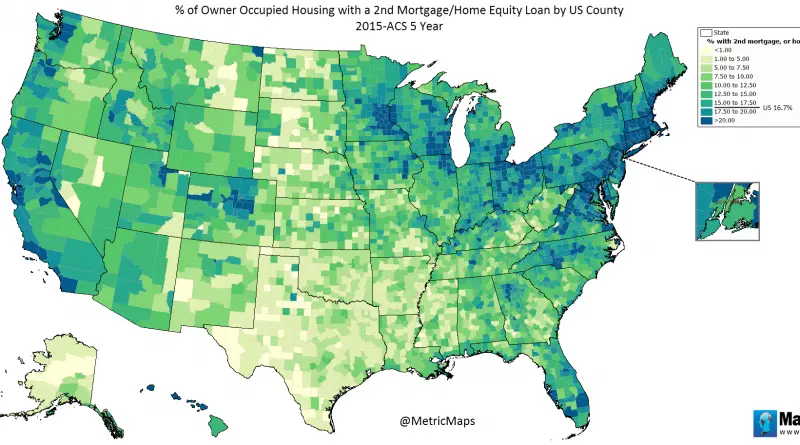
Source: https://metricmaps.org/2017/04/18/of-owner-occupied-housing-with-a-2nd-mortgagehome-equity-loan-by-us-county/
Read MoreReddit user: EtherealOptimist
Read More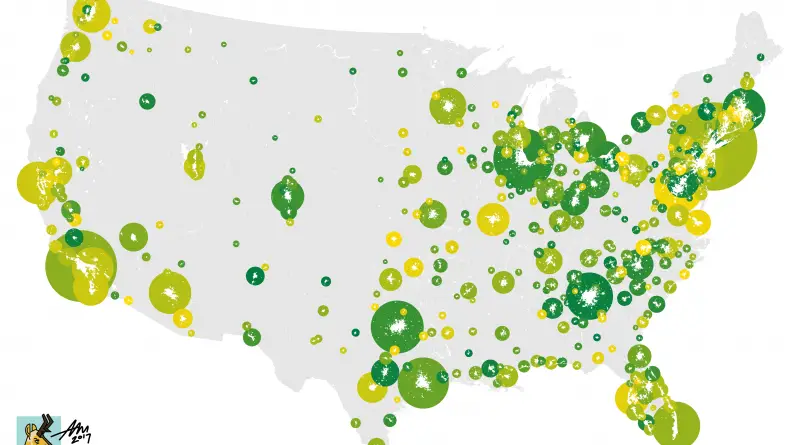
Reddit user: legitprivilege Largest metropolitan areas of the U.S.1 New York (New York–Newark–Jersey City) – 20,182,305 people 2
Read More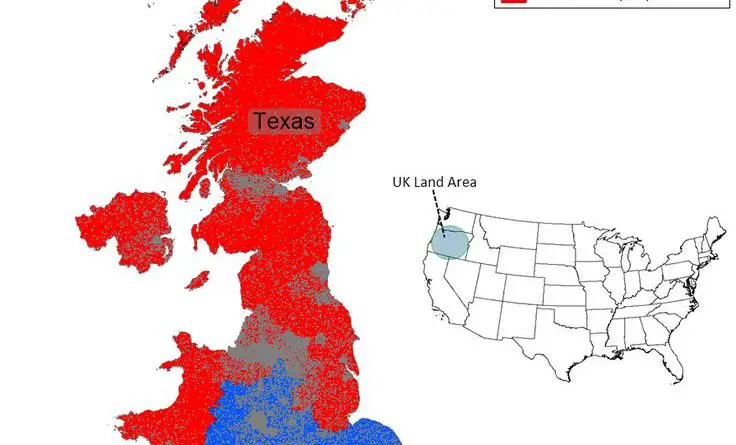
Source: https://metricmaps.org/2017/04/17/texas-and-california-population-overlapped-with-uk-population
Read More
Reddit user: AJgloe
Read More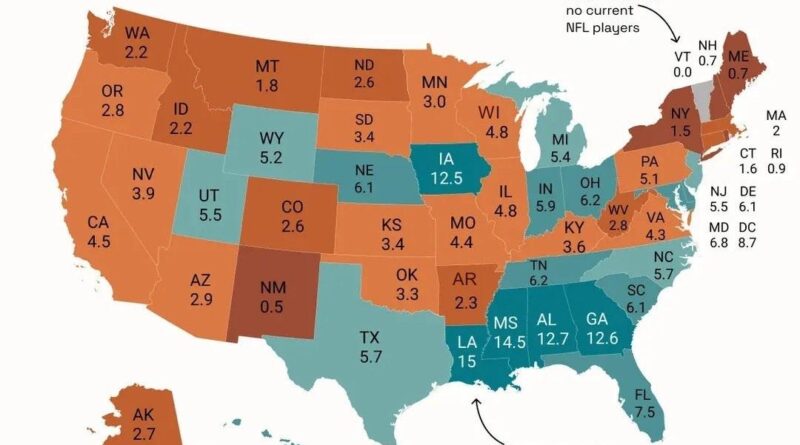
Why does Iowa rank alongside Louisiana, Mississippi, Alabama, and Georgia in NFL player production per capita? The answer involves weather, culture, and population math.
Read MoreReddit user: micas84
Read MoreWhat does your state do well? Reddit user: Homesanto Related post: – The United States of shame
Read More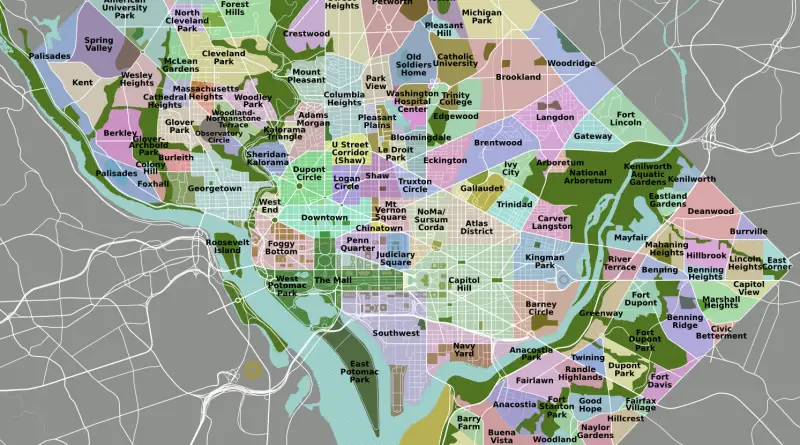
Related posts: – The neighbourhoods of Seattle – San Francisco neighbourhoods – The neighbourhoods of Manhattan
Read More