Countries richer & poorer than the world average (GDP per capita)
Reddit user: sandyisback
Read MoreMaps to explain economic geography.
Reddit user: sandyisback
Read More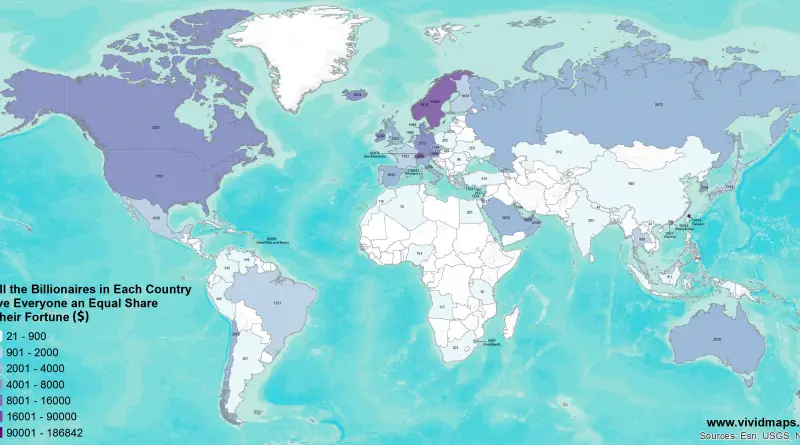
If All the Billionaires in Each Country Gave Everyone an Equal Share of their Fortune ($) If the Richest Billionaire
Read MoreThis map plots the first year in which the U.S. had the same GDP per capita, adjusted for prices, as
Read More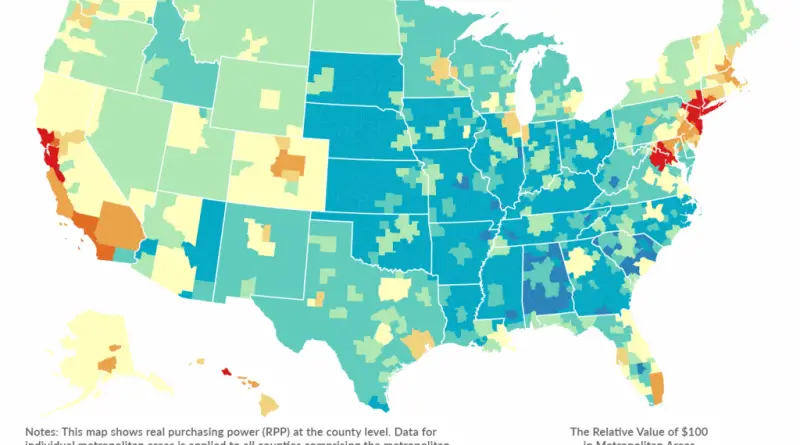
The map below shows real purchasing power (RPP) at the county level. Data for individual metropolitan areas is applied to
Read MoreBelow best and worst U.S. states by GDP, GDP change, and employment change. Five Best U.S. States 1. California ($2,301B
Read MoreSocial scientists have used the Gini coefficient as the most common measure of global inequality (the income or wealth distribution of a nation’s residents). It was developed by the Italian statistician and sociologist Corrado Gini and published in 1912. A Gini coefficient of zero expresses perfect equality, where everyone has the same income. A Gini coefficient of 1 (or 100%) expresses maximal inequality among peoples.
Read MoreReddit user: trinitronbx
Read MoreReddit user: FSMPBUH
Read MoreReddit user: vonsenke
Read MoreReddit user: thegeneralx
Read More