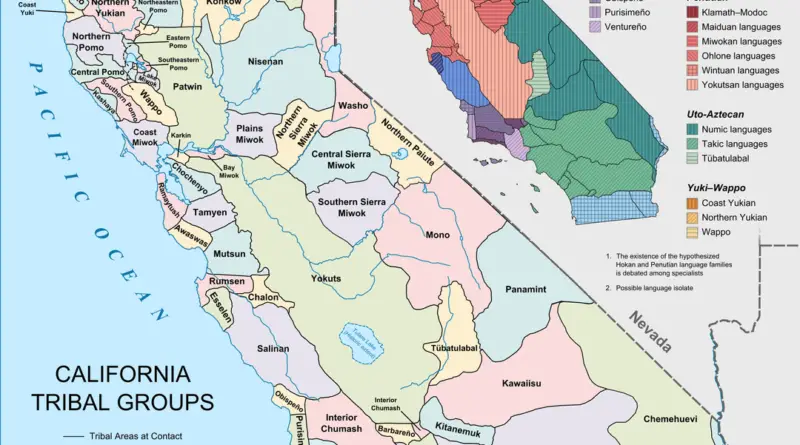
Largest Ancestry by U.S. County
The map below highlighted the national origin claimed by American citizens in each county.
Read MoreThe map below highlighted the national origin claimed by American citizens in each county.
Read MoreIn the United States, the sex ratio at birth is typically close to 105 males for every 100 females. This slight male predominance at birth is a natural phenomenon observed in many countries.
Read Morehile regional concentrations of minority groups are evident, the United States’ diverse population distribution reflects a complex interplay of historical legacies, migration flows, economic opportunities, and cultural identities, shaping the nation’s social fabric and contributing to its rich multicultural tapestry.
Read MoreThe average height of individuals across Asian countries exhibits a diverse range, shaped by a multitude of factors such as genetics, nutrition, healthcare, and socio-economic conditions. Generally, Asians are not uniformly distributed in terms of height, and there is considerable variation among different populations.
Read MoreThe U.S. Census continues to recognize six racial categories: White American, Black or African American, American Indian and Alaska Native, Asian American, Native Hawaiian, and Other Pacific Islander. Additionally, the U.S. Census Bureau classifies Americans as “Hispanic” and “Not Hispanic,” identifying Hispanic Americans as an ethnicity distinct from others and constituting the largest minority group in the nation.
Read MoreThe American Indian population, also known as Native Americans or indigenous peoples of the Americas, comprises a diverse group of ethnicities, cultures, and languages. They are the descendants of the original inhabitants of the Americas before European colonization. The ancestors of modern American Indians arrived in America at least 15 thousand years ago from Asia. Historically, the country’s indigenous people had a population of nearly 10 million before European settlers explored America.
Read MoreAsian Americans are a vibrant and diverse community, making up about 7.2% of the U.S. population. This article explores the ethnic composition, spatial distribution, and historical growth of Asian Americans, highlighting the areas with the highest and lowest concentrations. With detailed maps and animations, gain insights into the significant contributions and dynamic presence of Asian Americans across the United States.
Read MoreThe Black American population is an integral part of the U.S., with significant contributions to the nation’s culture and history. This article explores the distribution, concentration, and changes in the Black population over time, highlighting states and counties with the highest numbers and percentages. Discover detailed insights supported by an animated map from 1990 to 2022.
Read MoreHispanic Americans are a vibrant and integral part of the U.S. population. This article explores their distribution, states and counties with the highest and lowest percentages, and changes over time, supported by an animated map from 1990 to 2022. Discover fascinating insights into this dynamic community.
Read MoreIn 2011, for the first time in United States history, non-Hispanic whites accounted for under half of the births in
Read More