What is missing? – Creating a global memorial to the planet
Designed by Maya Lin as her last memorial, What is Missing? creates, through science-based artworks, an awareness about the present
Read MoreDesigned by Maya Lin as her last memorial, What is Missing? creates, through science-based artworks, an awareness about the present
Read MoreGiven a starting point it shows what you can reach within a certain time limit using public transportation (so subway,
Read MoreThis map shows Google search interest in voting-related issues across the United States at city level. Cities only show up
Read MoreThe New York City Street Tree Map brings New York City’s urban forest to your fingertips. For the first time,
Read MoreSource: www.coaxs.mit.edu/job-map/ Jobs (according to 2014 LEHD data) in the MBTA primary and secondary assessment districts, by industry and
Read MoreControl: – Click on a building footprint for zone and parcel information. – Use shift + up and down/left and
Read MoreVia nytimes.com Related posts: – Uninsured rate by U.S. State (2008 – 2014) – Uninsured rate by U.S. County (2008
Read MoreThis video will show the entire history of the British Isles from the arrival of modern humans to 2016. Every
Read More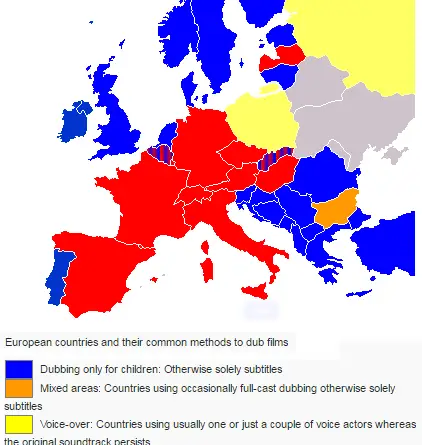
European countries who are dubbing foreign movies vs. countries who use subtitles.
Read MoreSan Francisco Los Angeles New York City
Read More