The atlas of economic complexity
The Globe is built upon The Atlas of Economic Complexity, a powerful interactive tool that enables users to visualize a
Read MoreThe Globe is built upon The Atlas of Economic Complexity, a powerful interactive tool that enables users to visualize a
Read MoreThe NAG Greenpoint-Williamsburg ToxiCity Map is an interactive map of toxic “hot spots” in Greenpoint and Williamsburg. Data used to
Read MoreOver 58,000 air traffic routes visualized in one map…using ArcGIS. Via arcgis.com
Read MoreVia sayiyon.com
Read More2016 2020 Via renewoureconomy.org
Read More
Dive into the complex economic ecosystem of New York City through a series of revealing maps. From neighborhood-level economic indicators to mobility and opportunity insights, uncover the diverse economic stories of the Big Apple’s five boroughs.
Read More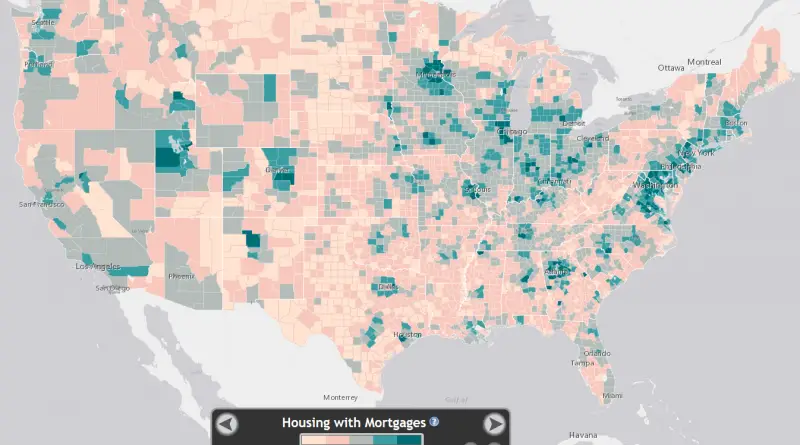
www.atlas.esri.com/Atlas/Housing_Atlas.html?t=2&m=1&x=-98.79&y=37.47&l=5 Part of the American Dream is owning your own home. This map shows the percentage of occupied housing that
Read MoreIn descending order of number of new titles per year, as of the latest year available, sometimes “new titles &
Read MoreTraditional maps of election results tend to paint the US as red or blue which hides a number of important
Read More