20 Best Maps of 2018
The maps are ranked on the number of visitors each received in 2018. 20. Six ways to divide the Roman
Read More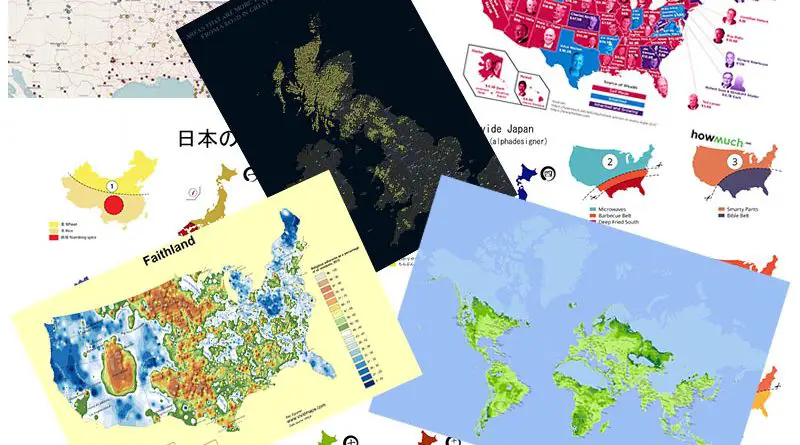
The maps are ranked on the number of visitors each received in 2018. 20. Six ways to divide the Roman
Read More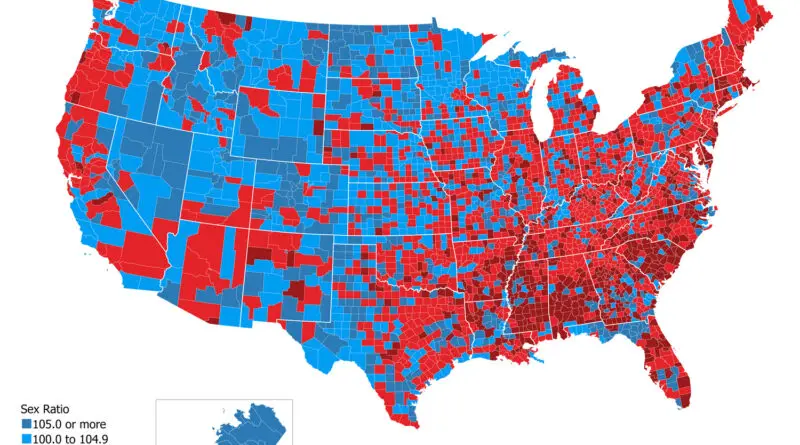
In the United States, the sex ratio at birth is typically close to 105 males for every 100 females. This slight male predominance at birth is a natural phenomenon observed in many countries.
Read More
he New York Times is an American newspaper based in New York City with worldwide impact and readership. The New York Times was founded on September 18, 1851, by Henry Jarvis Raymond and George Jones. It has a long and storied history as one of the most respected newspapers in the U.S.
Read More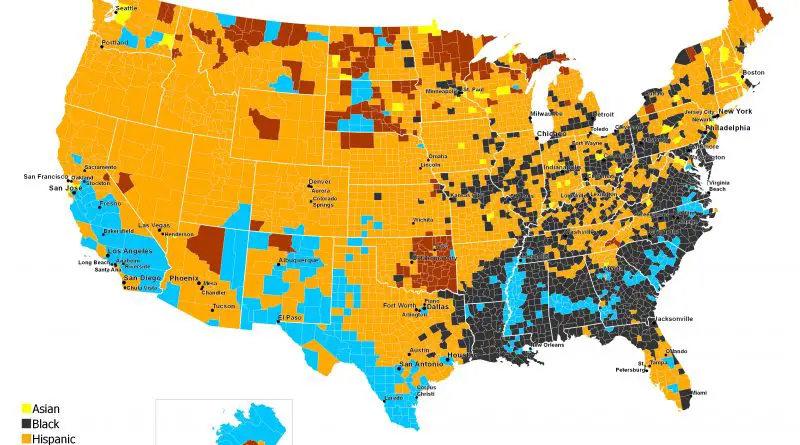
hile regional concentrations of minority groups are evident, the United States’ diverse population distribution reflects a complex interplay of historical legacies, migration flows, economic opportunities, and cultural identities, shaping the nation’s social fabric and contributing to its rich multicultural tapestry.
Read More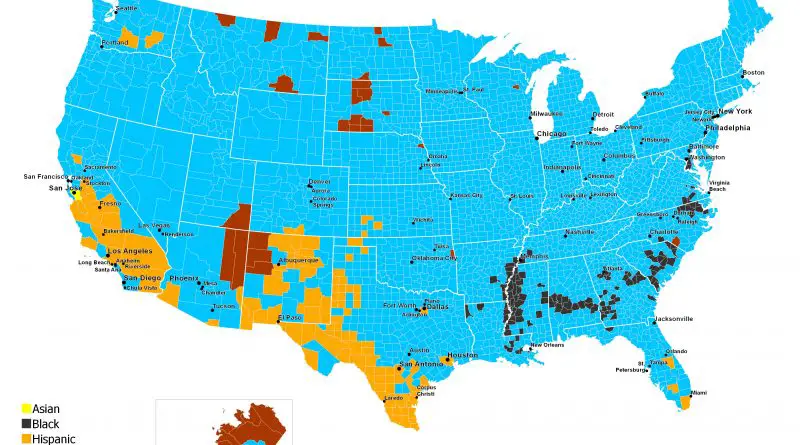
The U.S. Census continues to recognize six racial categories: White American, Black or African American, American Indian and Alaska Native, Asian American, Native Hawaiian, and Other Pacific Islander. Additionally, the U.S. Census Bureau classifies Americans as “Hispanic” and “Not Hispanic,” identifying Hispanic Americans as an ethnicity distinct from others and constituting the largest minority group in the nation.
Read More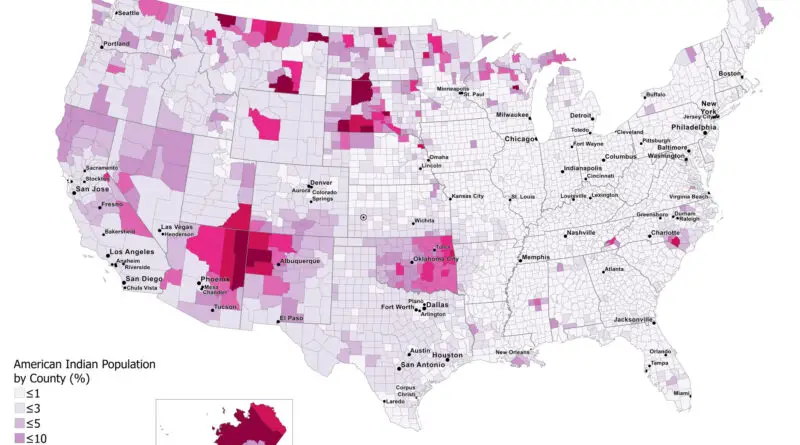
The American Indian population, also known as Native Americans or indigenous peoples of the Americas, comprises a diverse group of ethnicities, cultures, and languages. They are the descendants of the original inhabitants of the Americas before European colonization. The ancestors of modern American Indians arrived in America at least 15 thousand years ago from Asia. Historically, the country’s indigenous people had a population of nearly 10 million before European settlers explored America.
Read More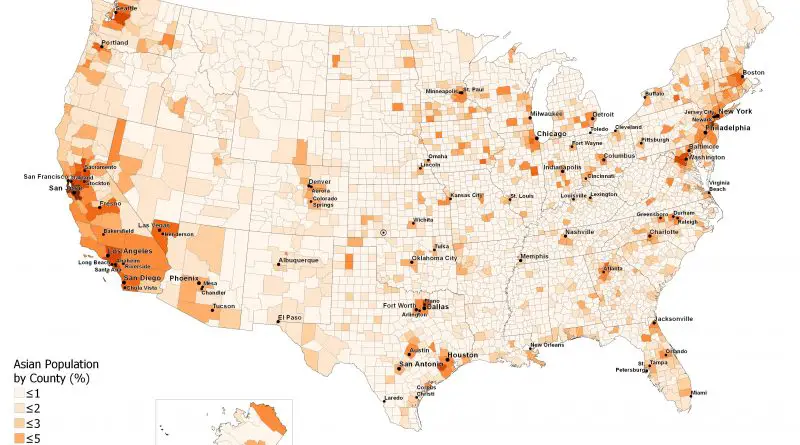
Asian Americans are a vibrant and diverse community, making up about 7.2% of the U.S. population. This article explores the ethnic composition, spatial distribution, and historical growth of Asian Americans, highlighting the areas with the highest and lowest concentrations. With detailed maps and animations, gain insights into the significant contributions and dynamic presence of Asian Americans across the United States.
Read More
The Black American population is an integral part of the U.S., with significant contributions to the nation’s culture and history. This article explores the distribution, concentration, and changes in the Black population over time, highlighting states and counties with the highest numbers and percentages. Discover detailed insights supported by an animated map from 1990 to 2022.
Read More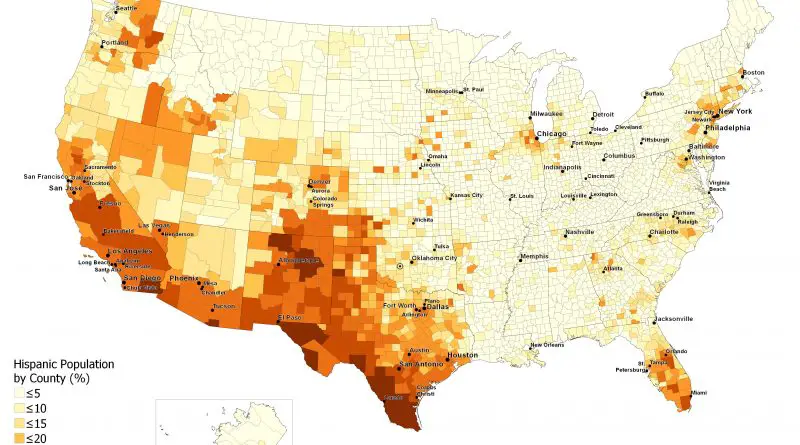
Hispanic Americans are a vibrant and integral part of the U.S. population. This article explores their distribution, states and counties with the highest and lowest percentages, and changes over time, supported by an animated map from 1990 to 2022. Discover fascinating insights into this dynamic community.
Read More
White non-Hispanic Americans are a significant part of the U.S. population. This article explores their distribution, states and counties with the highest and lowest percentages, and changes over time, supported by an animated map from 1990 to 2022. Discover fascinating insights and future predictions about this community.
Read More