United States Border Walls
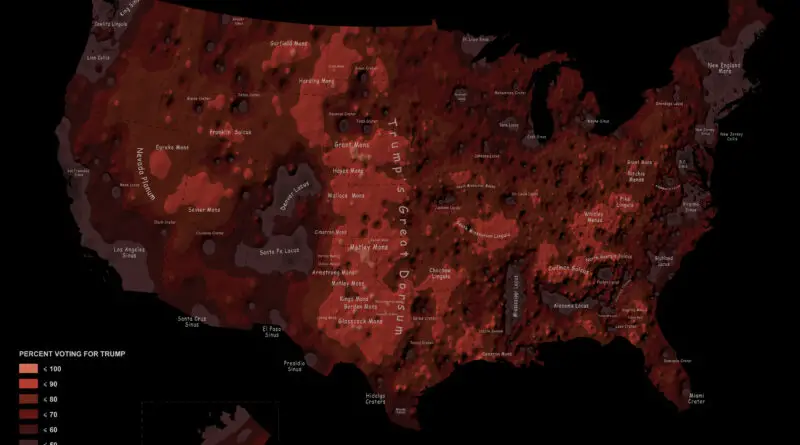
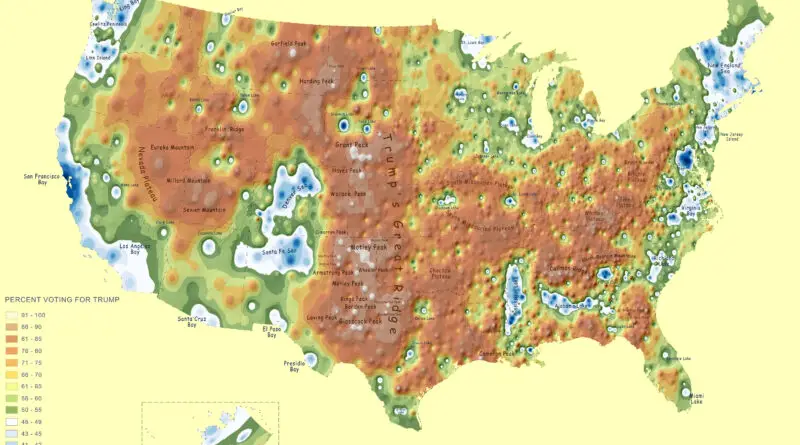
What if state and county borders weren’t just lines, but barriers shaped by elevation, rainfall, and population? This series of 3D maps that do just that—transforming geographic and demographic data into eye-catching visualizations.
Read More