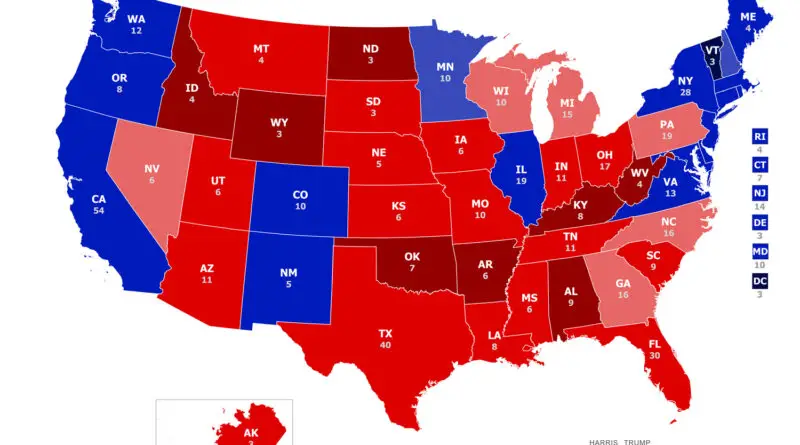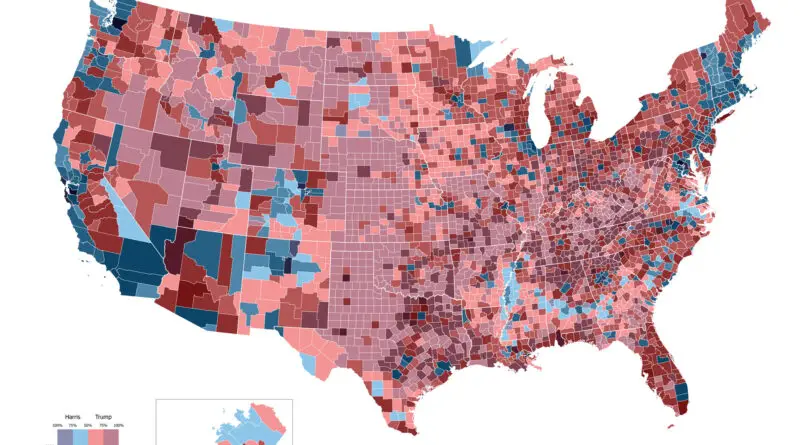
Mapping America’s Rightward Shift: The 2024 Presidential Election County by County
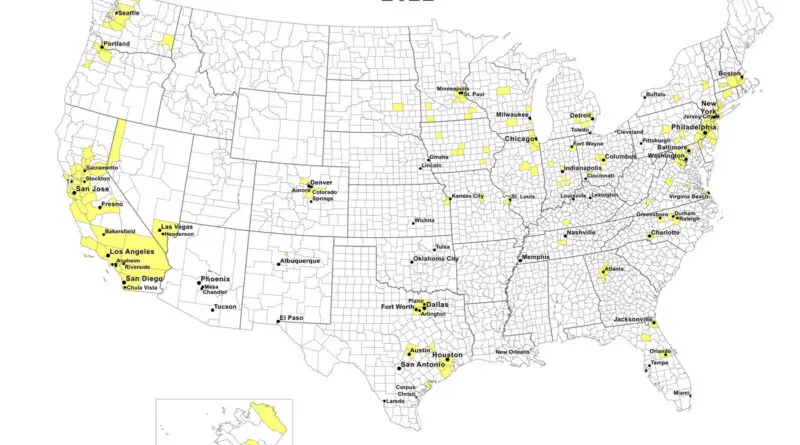
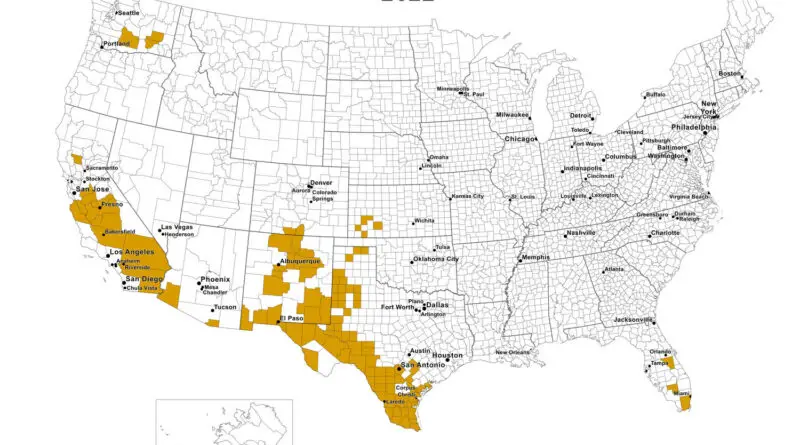
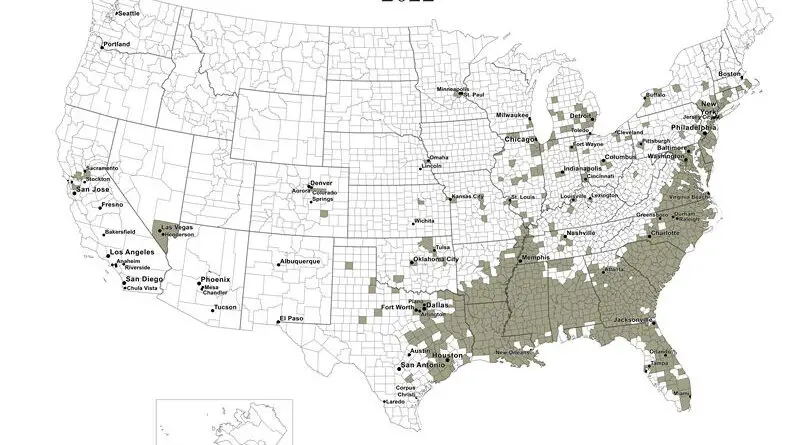
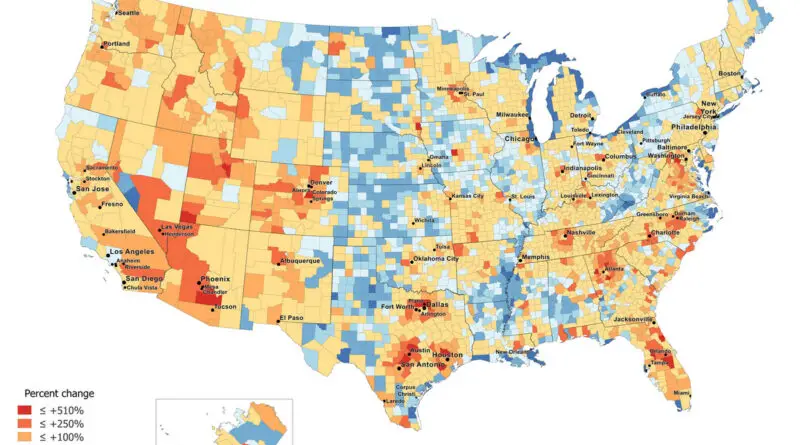
The 2024 election redrew America’s political map, with Trump winning by building surprising coalitions across rural and urban divides. These maps tell the story of an election that defied conventional wisdom.
Read More