Income Needed to be in the Top 1% in Each U.S. State
Income inequality in the United States is a complex and persistent issue with profound implications for the nation’s economy, society,
Read MoreMaps of the US
Income inequality in the United States is a complex and persistent issue with profound implications for the nation’s economy, society,
Read More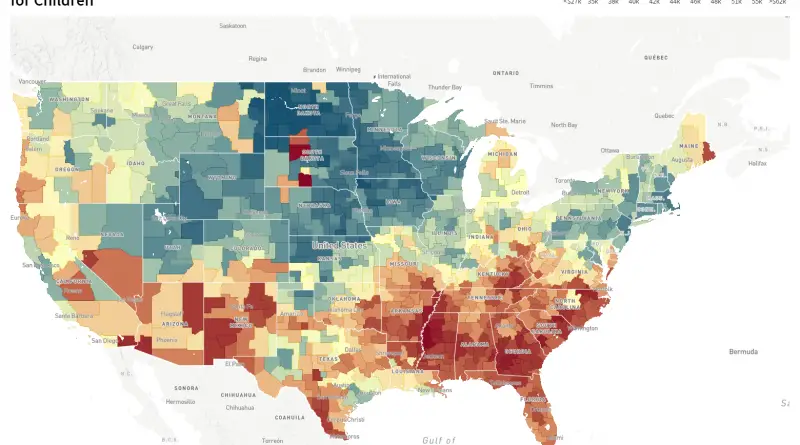
Discover “The Opportunity Atlas,” a revolutionary tool that maps economic mobility across the United States. In our comprehensive review, we delve into maps showing household income outcomes for children from different backgrounds, highlighting the crucial role of neighborhoods in shaping economic futures. Explore how this atlas can inform policies and interventions to enhance opportunities for all children.
Read More
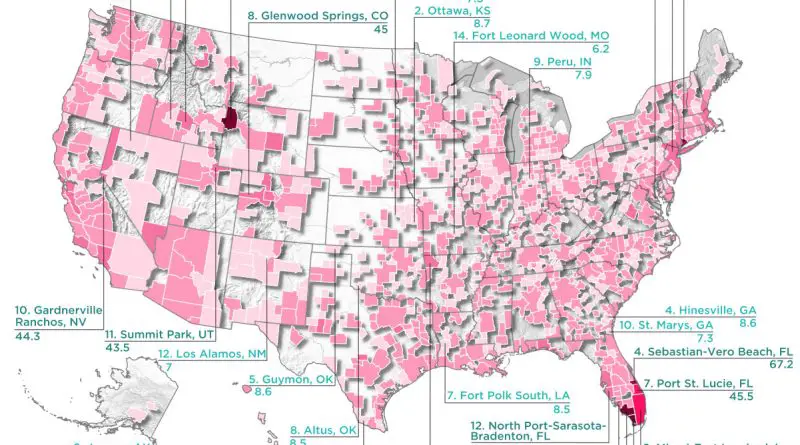
Every state has a story — and these maps help tell it. Whether it’s a surprising landmark, a little-known fact, or a unique spot on the map, this collection shows what makes each place in the U.S. one of a kind.
Read More
Understanding alcohol consumption patterns across the United States provides insights into cultural, social, and health-related aspects of American life. This analysis uses various maps to explore how alcohol consumption varies by state and county, highlighting trends in adult binge drinking, youth alcohol use, and regional differences. Discover intriguing facts about alcohol consumption and the implications for public health and policy.
Read More
White non-Hispanic Americans are a significant part of the U.S. population. This article explores their distribution, states and counties with the highest and lowest percentages, and changes over time, supported by an animated map from 1990 to 2022. Discover fascinating insights and future predictions about this community.
Read More
Dive into the history of New York City with Constantine Anderson’s axonometric map, and explore how the city’s population, skyline, and real estate have transformed over the decades.
Read More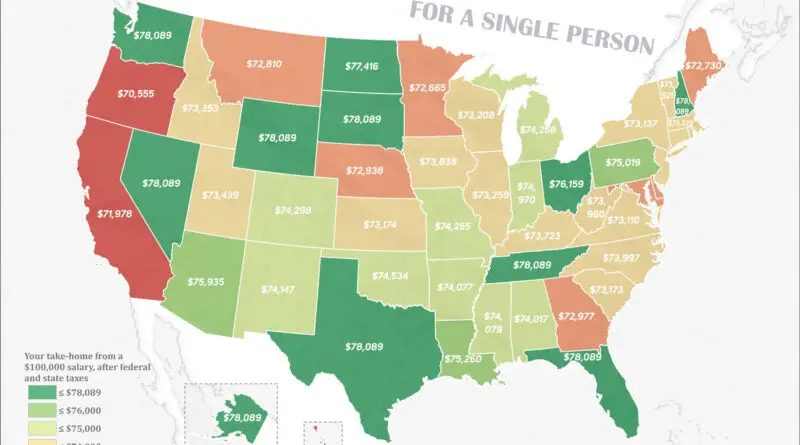
Discover the best and worst states for take-home pay on a $100,000 salary. Our detailed maps and analysis reveal how taxes and geography impact your net income across the United States.
Read More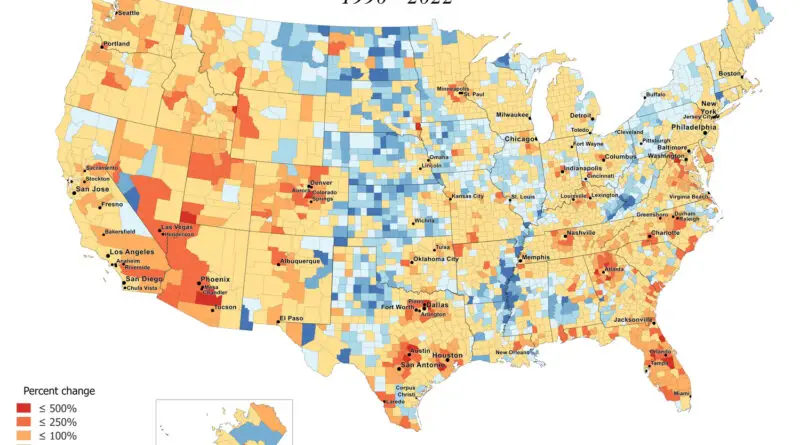
Our United States map reveals dramatic population shifts from 1990 to 2022. See which counties boomed, which declined, and understand the forces reshaping America’s demographic landscape.
Read More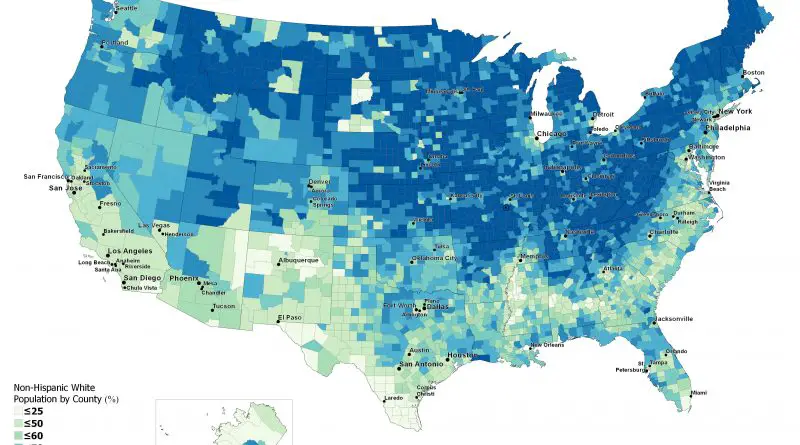
In 2011, for the first time in United States history, non-Hispanic whites accounted for under half of the births in
Read More
Explore the incredible diversity of California’s landscapes through the lens of the Paramount Studio map of 1927. Learn how this state can replicate regions like the French Alps, Siberia, the Sahara Desert, and more, making it a favorite for filmmakers around the world.
Read More