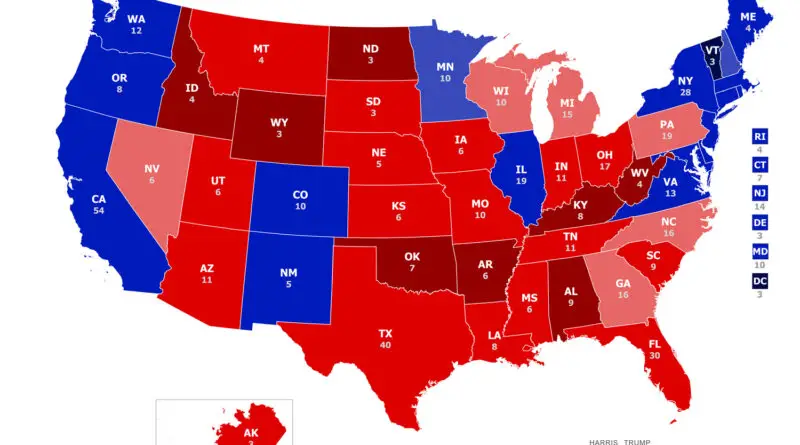
election

NewsPolitical mapsVivid maps

2020 U.S. Election Mapped: TrumpLand vs Biden Archipelago – A Tale of Two Americas

The 2020 U.S. presidential election revealed stark contrasts in how Americans vote based on where they live. These original maps show Biden’s urban archipelagos – centers of economic power generating 70% of U.S. GDP – scattered across Trump’s expansive heartland. From county-level analysis to population-weighted visualizations, these maps tell the story of two Americas: one concentrated in high-density cities, another spread across the rural landscape. Building on my viral 2016 electoral maps, this new series offers fresh insights into our nation’s deepening political geography.

Read More
Animated mapsPolitical maps

The U.S. Presidential Voting History Mapped

There have been 46 presidencies (including the contemporary one, Joe Biden, whose term began in 2021), and 45 different people have worked as president. Grover Cleveland was selected to 2 nonconsecutive terms, and as such, is regarded the 22nd and 24th president of the U.S.

While some U.S. states consistently have Democrat or Republican victories, other swings between the two parties. Here the U.S. presidential voting history science in 1789.

Read More